Preview image. Unlock full-res
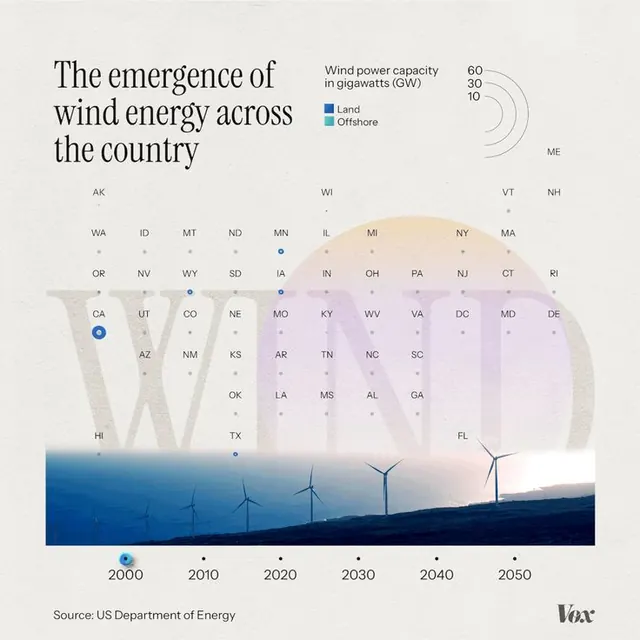
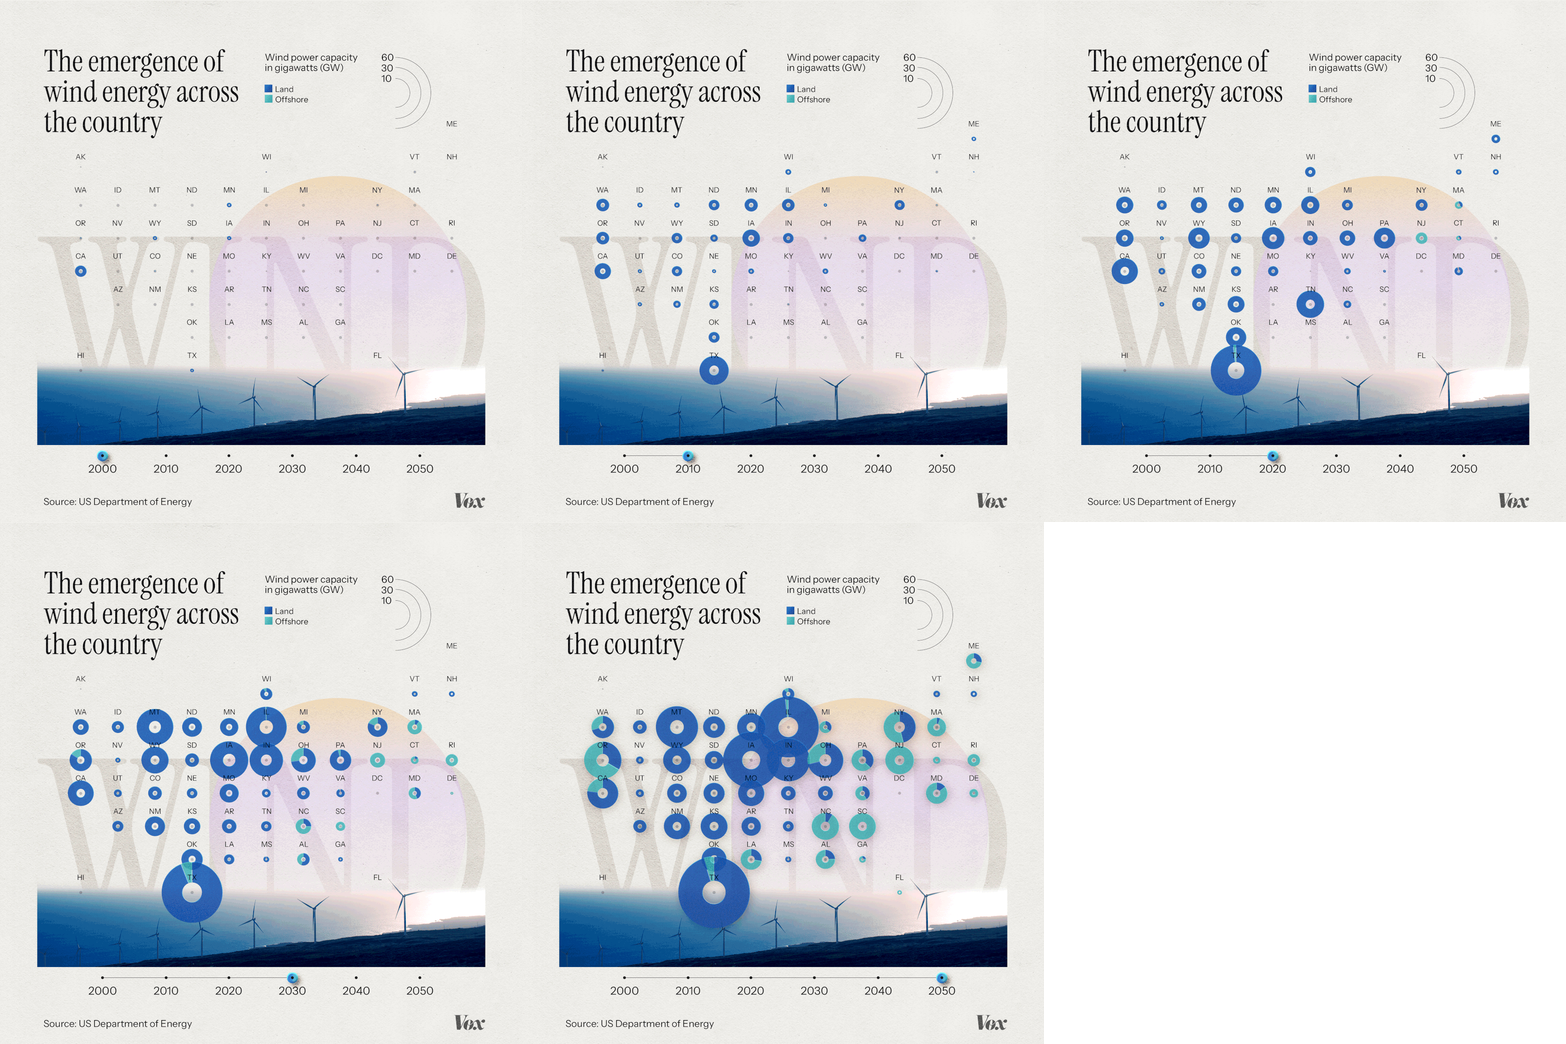
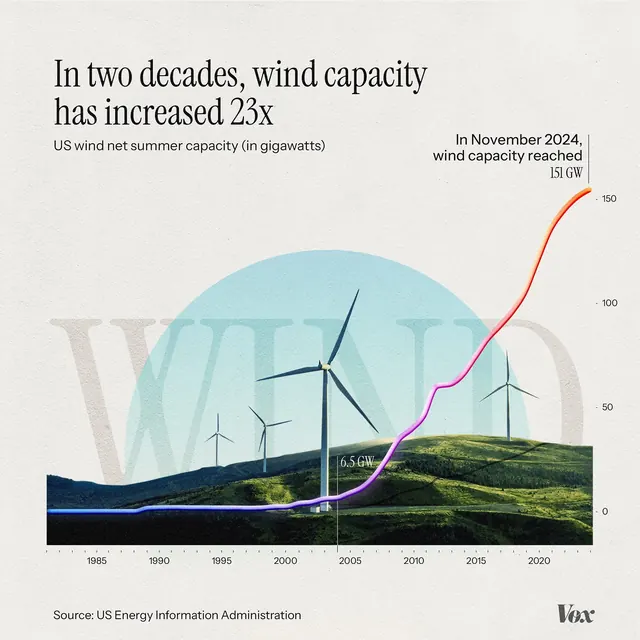
This is an infographic-style visualization tracking the projected wind power capacity across various US regions over time.
Summary
This is an infographic-style visualization tracking the projected wind power capacity across various US regions over time.
Visual description
This is an infographic-style visualization tracking the projected wind power capacity across various US regions over time. It uses a clean, minimalist design with subtle gradients and clear data points to convey complex environmental and energy statistics effectively. The layout is structured horizontally, using a map-like grid for states and a timeline along the x-axis to display capacity projections. Clean, sans-serif typeface is used for labels and titles, prioritizing readability.
Key takeaway
An infographic reference. Worth saving for its infographic, data visualization, minimalist treatment.
Reuse notes
Fits general design work.
More like this


Keep what you find
A free account saves references to boards and can send you a weekly email of picks based on what you save.
To see every result, go Pro.