Preview image. Unlock full-res
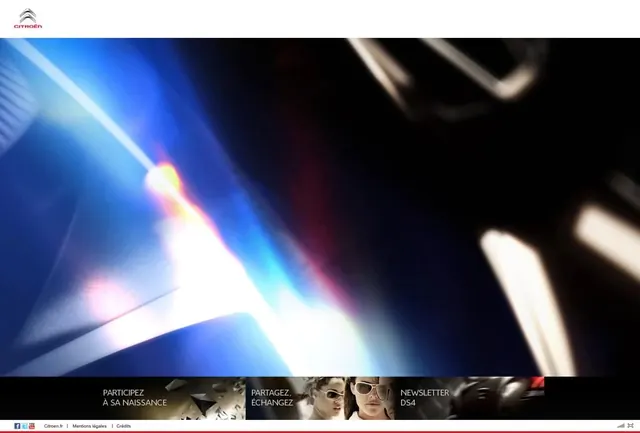
Website hero screenshot featuring automotive photography with lens-flare effects, dark background, and blue and white light streaks.
Summary
A website hero banner screenshot from a Citroën site, featuring dramatic automotive photography with purposeful lens-flare effects, deep blue tones, and bright white and cool-colored light streaks that create visual dynamism and premium product presentation.
Visual description
The hero section displays a blurred automotive photograph with strong lens-flare effects creating diagonal light streaks from the upper left. Primary colors are deep royal blue, near-black, and bright white/cool light tones. The image appears to show part of a vehicle or automotive product, with the flare and bokeh effects intentionally creating an aspirational, premium aesthetic. Below the hero image is a dark footer section with white text in French including "PARTICIPEZ A SA NAISSANCE", "PARTAGEZ, ÉCHANGEZ", and "NEWSLETTER DS4" along with the Citroën logo visible at the top. Navigation elements and social links appear at the very bottom.
Key takeaway
The deliberate use of lens-flare and light-streak effects to create drama and luxury positioning for an automotive brand. The soft-focus photographic approach with high-contrast lighting communicates premium quality and aspirational brand messaging. The color palette (rich blue, bright white, deep black) reinforces technical sophistication and elegance.
Reuse notes
Excellent reference for automotive or luxury brand website heroes that need dramatic, premium visual treatment. The lens-flare and bokeh effects work best paired with high-quality product photography and restrained typography. The deep blue and white color scheme is effective for automotive brands seeking a technical, confident aesthetic.
More like this
Keep what you find
A free account saves references to boards and can send you a weekly email of picks based on what you save.
To see every result, go Pro.