Preview image. Unlock full-res
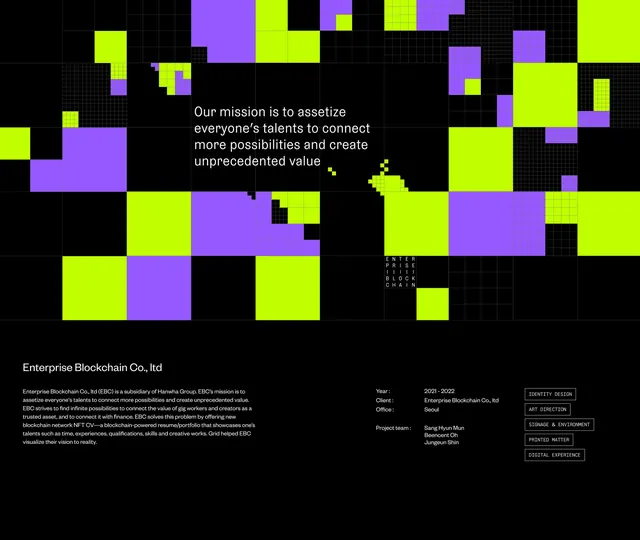
A dark background filled with an irregular grid of neon yellow and purple blocks, punctuated by centered mission text and company metadata in a structured layout.
Summary
An enterprise blockchain company identity using an irregular neon-grid background to frame a centered mission statement and structured metadata panel, all on black.
Visual description
A full-bleed black canvas overlaid with an irregular pattern of neon yellow (lime) and electric purple blocks of varying sizes, arranged in a loose grid. The blocks do not align to a strict column system but appear organically scattered across the composition, creating visual tension and suggesting data flow or networked nodes. Centered near the top in white sans-serif sits the mission statement: "Our mission is to assetize everyone's talents to connect more possibilities and create unprecedented value." Below the statement, a structured metadata panel in the lower left displays company name, project details, and hashtags in small monospace and sans-serif, bordered by simple rules. The neon palette and dark ground create maximum contrast and a contemporary tech aesthetic.
Key takeaway
The background grid becomes texture, not a hard system, suggesting complexity without being rigid. Layering the mission text atop the chaotic geometry makes it the focal point through contrast. The metadata panel adds governance and structure, grounding the abstract top half.
Reuse notes
Effective for blockchain and fintech pitch decks, annual reports, and corporate identity systems. The neon duotone scales well to web backgrounds, social media, or printed collateral. Works best for technology and enterprise audiences; may read as overwrought for consumer-facing brands.
More like this

Keep what you find
A free account saves references to boards and can send you a weekly email of picks based on what you save.
To see every result, go Pro.