Preview image. Unlock full-res
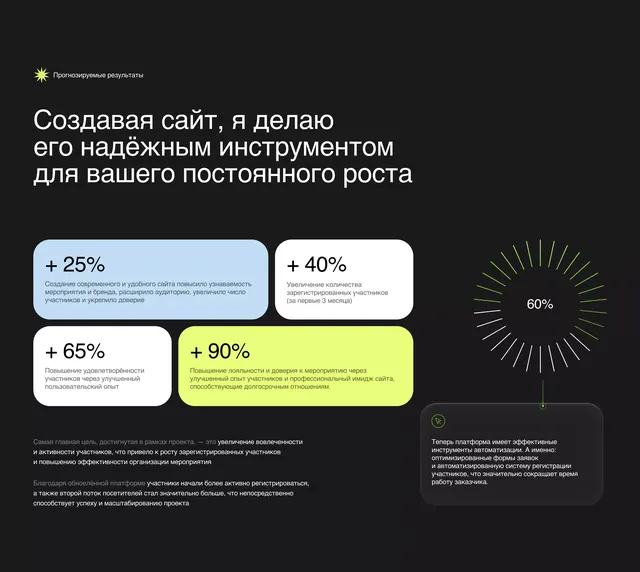
Analytics dashboard on dark background with metric cards in contrasting pale blue, white, and neon yellow, plus a circular progress indicator with radiating spokes.
Summary
Dark-themed dashboard interface featuring metric cards in pale blue, white, and neon yellow, arranged in an asymmetric grid with a circular progress gauge and radiating-line visualization on the right.
Visual description
A dark charcoal background hosts a dashboard layout with left-aligned metric cards and a right-aligned gauge visualization. Four metric cards display percentage values (25%, 40%, 65%, 90%) and accompanying label text in sans-serif type; three cards use pale blue or white backgrounds while the largest uses electric neon yellow. The cards employ rounded corners and subtle drop shadows. At right, a circular gauge with a central label "60%" is surrounded by evenly spaced radiating lines like a sun or starburst pattern, drawn in the same neon yellow. A headline in Russian sans-serif sits at the top with a small yellow icon above. Body copy in light gray text is positioned at the bottom and right edges. The composition uses the neon yellow as the primary accent color, creating high contrast against the dark backdrop and drawing the eye from card to gauge.
Key takeaway
Neon yellow as a single accent color unifies disparate UI elements. Metric cards with distinct background colors add visual hierarchy without complexity. The radiating-line gauge is a simple geometric treatment that signals motion or data growth. Dark background allows maximum contrast and reduces visual fatigue in data-heavy interfaces. Sans-serif type at multiple weights maintains legibility across dense information.
Reuse notes
Ideal for analytics, SaaS dashboards, or developer tools where dark mode is standard. The neon yellow works best in tech products and fintech. Card-based metric layout is flexible for different data types. The radiating gauge works for progress, growth, or completion indicators. Would need careful adaptation for mobile or accessibility requirements around the high contrast ratios.
More like this

Keep what you find
A free account saves references to boards and can send you a weekly email of picks based on what you save.
To see every result, go Pro.