Preview image. Unlock full-res
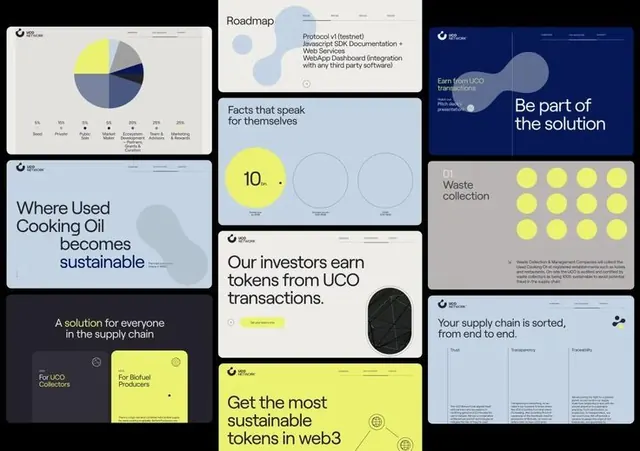
Dashboard system for a blockchain-based supply-chain platform, combining navy backgrounds with bright yellow callouts, circular data visualizations, and modular card layouts.
Summary
A dashboard system for tracking blockchain-based sustainability initiatives, using navy backgrounds, bright yellow data highlights, and modular card components to organize complex supply-chain information.
Visual description
The layout spreads across multiple card-style frames arranged in a loose grid. Each card shows a distinct dashboard section: a pie chart labeled "Where Used" with navy, teal, and light-blue segments; a roadmap card listing protocol documentation steps; a "Facts that speak for themselves" section with nested circular visualizations at different scales, one number (10) emphasized in bright yellow; a dark card reading "Be part of the solution"; another yellow-background card titled "Waste collection" with a 4x4 grid of yellow dots; a dark-blue hero card with white headline text; a black-background section about investor tokens with yellow highlights; and a final light-background card with three columns of text labeled "Your supply chain is sorted". The color palette is consistently: deep navy/dark blue, bright #EDF276 yellow, white, and light cool grays. Type is clean, modern sans-serif, left-aligned or flush-left in most cards.
Key takeaway
The yellow-on-dark contrast creates immediate visual hierarchy without oversaturation. The modular card approach lets each data type (chart, grid, text, metric) have its own space while staying cohesive. Using a single bright accent color across many card types ties the system together and makes KPIs and CTAs unmissable.
Reuse notes
Strong fit for fintech, blockchain, and enterprise SaaS dashboards where trust and transparency are the message. The card grid pattern works well for annual reports, investor decks, and sustainability communications. Works best on dark or light backgrounds; the yellow is so vibrant it needs high contrast to land cleanly.
More like this

Keep what you find
A free account saves references to boards and can send you a weekly email of picks based on what you save.
To see every result, go Pro.