Preview image. Unlock full-res
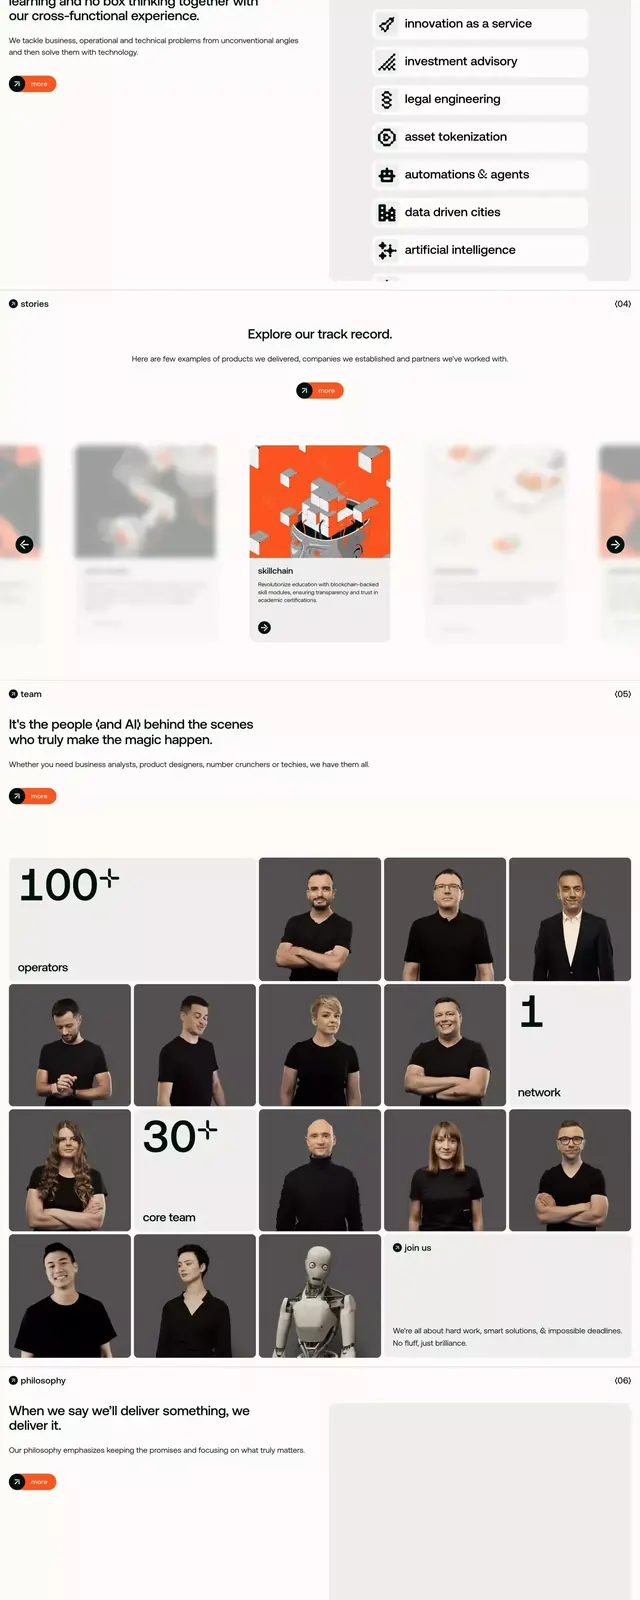
Multi-section infographic documenting information organization principles, design mood taxonomy, and reference photography across visual disciplines.
Summary
A structured infographic guide for information-object taxonomy, mood/tone classification, and design style references for technical and corporate environments.
Visual description
Vertical scrolling infographic with five distinct sections: a header introducing information objects, isometric 3D diagrams of stacked/pyramidal shapes in orange and blue illustrating organizational concepts, a multi-column grid mapping mood (professional, energetic, playful, etc.) against tone descriptors with color swatches, a reference gallery of photography and imagery styles (portraits, product, textures, composition types), a statistics or comparison grid with small thumbnail images, and a dark hero section at bottom with a glowing brain illustration and white sans-serif text. Dominant colors: off-white background, deep navy/teal, warm orange, with accent grays.
Key takeaway
The isometric shape treatment for explaining abstract concepts; the mood/tone matrix as a quick visual classification system; the photography reference gallery layout (grid of small, labeled examples) for showing style variety without lengthy descriptions.
Reuse notes
Works well for B2B SaaS, design systems documentation, and engineering/product blogs. Best for explaining methodology, principles, or classification frameworks. Neutral color palette and clean typography suit corporate and startup audiences equally.
More like this

Keep what you find
A free account saves references to boards and can send you a weekly email of picks based on what you save.
To see every result, go Pro.