Preview image. Unlock full-res
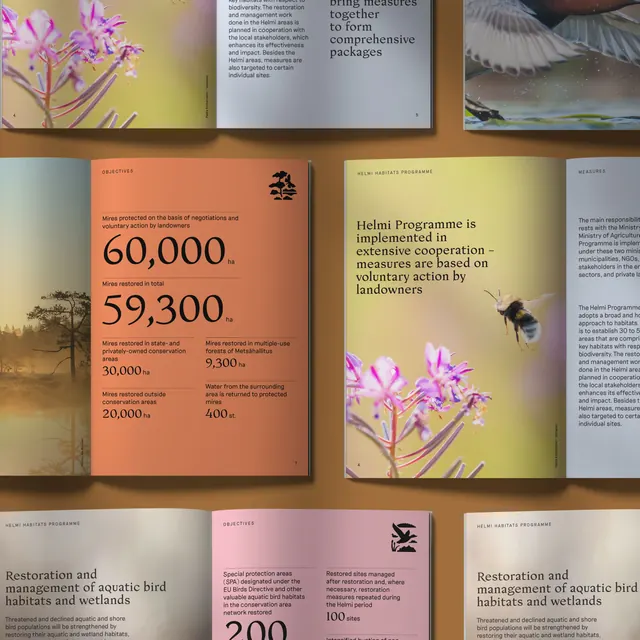
Environmental conservation report series with modular brochure spreads using earthy color blocks, wildlife photography, and data-dense typography to communicate habitat restoration metrics.
Summary
Multi-page environmental conservation report for the Helmi Habitats Programme using modular page layouts with earthy color blocks, wildlife and habitat photography, and large-scale typography to present habitat-restoration data and program impact.
Visual description
A series of report pages arranged in a grid showcases a consistent, modular design system. Color-blocked backgrounds (burnt sienna, pale yellow, soft grey, muted plum) alternate with white space and full-bleed photography. Wildlife appears prominently: purple flowers (top-left), nesting bird (center-right), bee on bloom (left side). Headlines use a bold serif or display typeface in dark tones, often combined with all-caps sans-serif for emphasis. Large numerical data (60,000 hectares, 59,300, 30,000, 20,000, 400) dominate orange and cream pages as key metrics. Body text is set in a clean sans-serif aligned left or centered. Navigation headers ("OBJECTIVES", "DELHI HABITATS PROGRAMME") anchor each spread. The layout grid remains consistent while color blocks and image crops vary per page.
Key takeaway
The combination of large-scale numerical data with color-blocked backgrounds makes metrics immediately scannable without requiring charts. The earthy, warm palette creates an accessible, trustworthy tone that feels institutional without being cold. The modular page system allows the same structure to carry wildly different content (metrics, photography, long-form text) without redesign.
Reuse notes
Ideal for nonprofit annual reports, government environmental initiatives, educational materials, or any data-heavy program seeking warmth and accessibility. Works especially well when the program has compelling photography of wildlife or landscapes. The serif-and-sans pairing is readable in print and digital contexts. Avoid using if the data set is complex (multi-variable charts work better in a different system).
More like this






Keep what you find
A free account saves references to boards and can send you a weekly email of picks based on what you save.
To see every result, go Pro.