Preview image. Unlock full-res
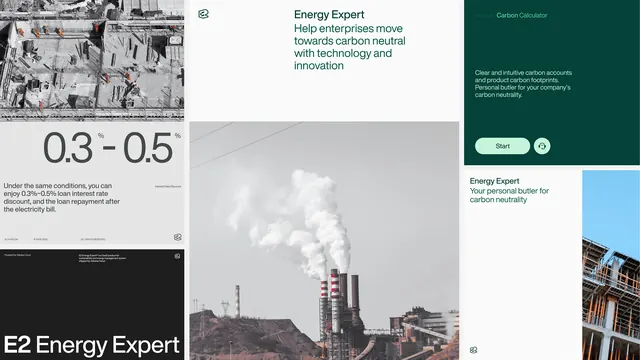
Carbon-neutral fintech/energy interface combining industrial aerial photography, data metrics, and dark teal accents across a grid-based layout.
Summary
Energy expert platform layout combining industrial city and factory imagery with metric callouts (0.3-0.5 range), teal CTAs, and a dark left sidebar in a modular multi-column grid.
Visual description
A multi-column composition mixing grayscale photography with bright accents. The left column displays a large grayscale aerial image of an industrial cityscape and smoke stack. Below it sits a metrics callout showing "0.3 - 0.5" in large numbers with supporting explanatory text. The center column has a gray atmospheric photograph (possibly clouds or industrial output). The right side features a dark teal card with white text describing "Energy Expert" positioning and carbon reduction, paired with a teal rounded button and an info icon. Below that, a pale blue section holds another image. All sections use off-white background, dark gray text, and subtle separation lines. The overall layout is rigidly modular and grid-aligned with generous breathing room between sections.
Key takeaway
A grid-based layout where photography, data, and copy sit in separate containers without overlapping. Dark teal as an accent color commands attention against neutral backgrounds. Mixing grayscale with selective color focus (the teal card) creates visual hierarchy without contrast overload.
Reuse notes
Ideal for fintech, energy, or data-heavy B2B services. The industrial imagery establishes credibility in energy/climate tech. The modular layout scales well for multiple sections (hero, features, testimonials). Use when you have strong supporting imagery and need to display both narrative and metrics.
More like this


Keep what you find
A free account saves references to boards and can send you a weekly email of picks based on what you save.
To see every result, go Pro.