Preview image. Unlock full-res
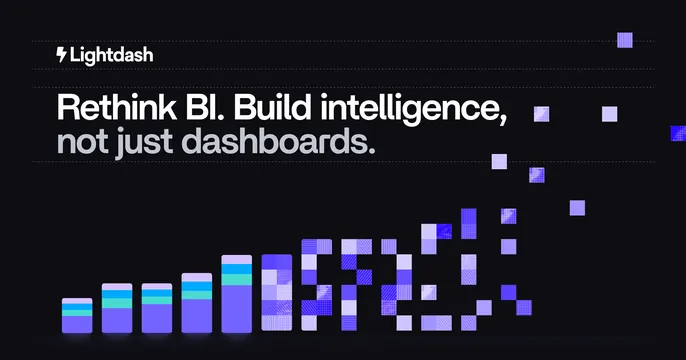
Black OG card with a two-tone left headline above a rising bar chart that dissolves into scattered pixel squares.
Summary
A dark BI card with a two-tone headline up top and a stacked-bar chart along the bottom that disintegrates into scattered violet pixel squares toward the right.
Visual description
The background is near-black with faint horizontal dotted gridlines spanning the width. Top-left carries a white lightning-bolt mark and the "Lightdash" wordmark. Below, a two-line headline reads "Rethink BI. Build intelligence," in white and "not just dashboards." in muted gray. Across the lower half, a row of multicolor stacked bars (violet, teal, lilac) rises left to right, then breaks apart into a field of small violet and lavender squares of varying opacity and texture that scatter upward and off the right edge, like data dispersing.
Key takeaway
The chart that physically dissolves into scattered pixels turns a generic bar graphic into a memorable "beyond dashboards" metaphor. Splitting the headline into a white statement and a gray qualifier sets up a clear contrast.
Reuse notes
Strong for BI, analytics, and data platforms wanting a technical, on-brand abstract instead of a UI screenshot. The dissolve effect needs room along the bottom; works only on dark, and the gray second line should stay readable.