Preview image. Unlock full-res
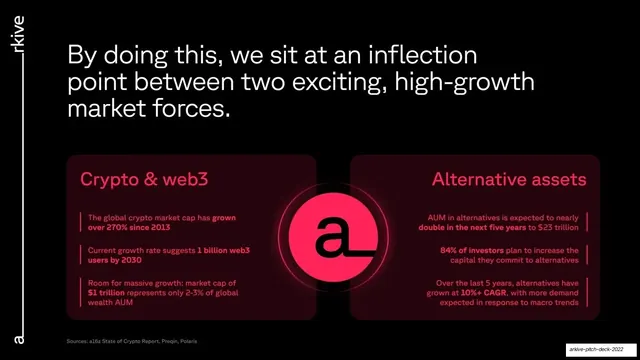
Two dark-red glassy panels, Crypto & web3 versus Alternative assets, flank a glowing pink "a" monogram token to frame the market opportunity.
Summary
The market slide: a glowing pink circular "a" monogram sits between two dark-red glassy panels, "Crypto & web3" on the left and "Alternative assets" on the right, each holding three stat bullets that frame the opportunity.
Visual description
Black background. A three-line white headline runs across the top: "By doing this, we sit at an inflection point between two exciting, high-growth market forces." Below, two wide rounded panels in deep desaturated red sit side by side with a gap. Left panel, titled "Crypto & web3" in pink, lists three tick-marked stats (crypto market cap grown over 270% since 2013, 1 billion web3 users by 2030, market cap only 2-3% of global wealth AUM). Right panel, titled "Alternative assets" in pink and right-aligned, lists three stats (AUM in alternatives expected to nearly double to $23 trillion, 84% of investors plan to increase allocation, 10%+ CAGR over five years). In the center gap, a glowing pink circle holds the black lowercase "a" monogram, with concentric ring glows, bridging the two panels. A small sources line sits bottom-left; the "arkive" wordmark runs up the left edge.
Key takeaway
Putting the brand mark in the gap between two market panels so the company literally sits "between two forces", visualizing the thesis rather than just stating it. The glowing monogram token doubles as the slide's focal point and a brand moment.
Reuse notes
A reusable "intersection / inflection point" market slide for anything positioned where two trends meet. Mirror the two panels (one left-aligned, one right-aligned) and keep three credible, sourced stats each. The center mark is the signature move; it needs a strong logo and a dark background to glow. Cite sources for the numbers.
From this deck: Inflection point, crypto and alternative assets market
View deck
More like this


Keep what you find
A free account saves references to boards and can send you a weekly email of picks based on what you save.
To see every result, go Pro.