Preview image. Unlock full-res
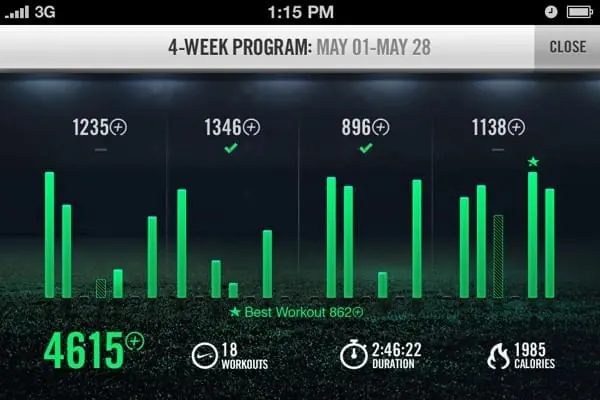
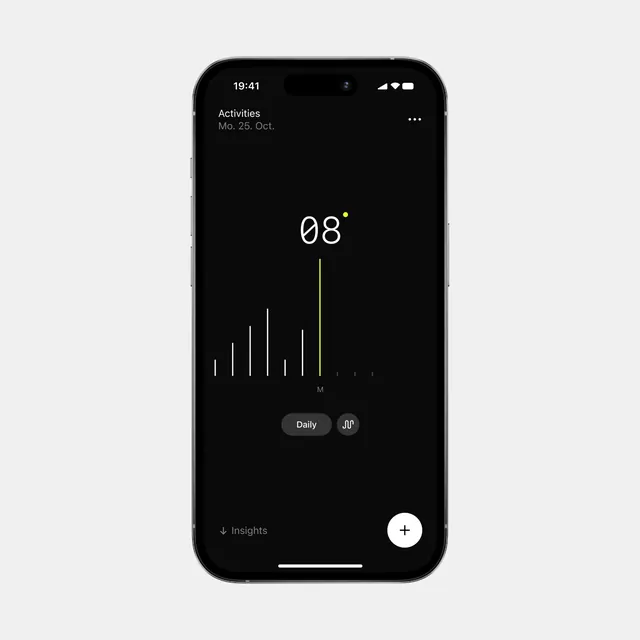
A data-dense mobile UI screen displaying a 4-week progress summary with bar charts and key performance metrics.
Summary
A data-dense mobile UI screen displaying a 4-week progress summary with bar charts and key performance metrics.
Visual description
A dark-themed mobile interface featuring four green bar charts representing weekly data. The bottom section displays large numerical metrics for total points, hours, and average time with accompanying icons.
Key takeaway
Uses high-contrast green accents against a dark background to emphasize data growth and key performance indicators.
Reuse notes
Apply this layout for tracking user progress or performance metrics in a mobile application.
More like this
Keep what you find
A free account saves references to boards and can send you a weekly email of picks based on what you save.
To see every result, go Pro.