Preview image. Unlock full-res
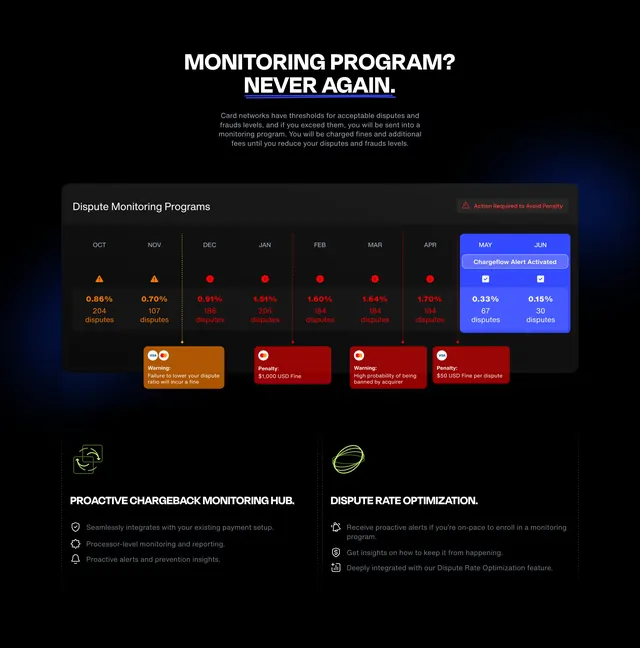
Dark feature with NEVER AGAIN headline, dispute monitoring timeline from penalties to alert activation, and two lime icon bullet columns.
Summary
Protection story showing monitoring program risk timeline turning green after Chargeflow Alert activation plus feature bullets below.
Visual description
Black background. Top white caps MONITORING PROGRAM NEVER AGAIN with blue underline on NEVER AGAIN and gray paragraph on network thresholds and fines. Center dark gray rounded dashboard titled Dispute Monitoring Programs with red Action Required warning. Horizontal OCT through JUN timeline: orange warning months Oct Nov, red penalty months Dec through Apr with climbing dispute percentages and fine callout boxes below; blue highlighted May Jun after Chargeflow Alert Activated banner showing drop to 0.33 and 0.15 percent with checkmarks. Bottom two columns with lime icons: Proactive Chargeback Monitoring Hub and Dispute Rate Optimization each with three small-icon bullet lines.
Key takeaway
Month-by-month timeline with color-coded escalation makes abstract compliance risk visceral. Blue activation window provides clear before-and-after narrative in one graphic.
Reuse notes
Strong for compliance or monitoring product pages. Timeline needs simplified mobile scroll; penalty copy must stay legally accurate.