Preview image. Unlock full-res
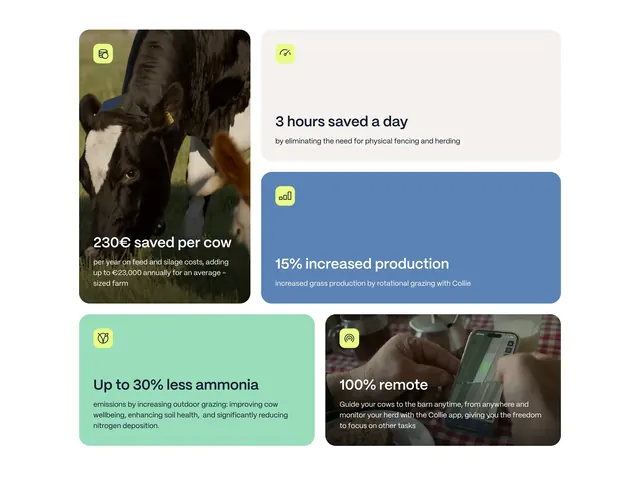
Five-tile bento grid quantifying per-cow savings, daily time saved, production gains, emissions reduction, and remote herding via app photo.
Summary
Collie benefits bento mixing cow collar photo tile with solid-color stat cards for euros saved, hours saved, production, ammonia, and remote control.
Visual description
Asymmetric grid of rounded tiles with lime square icons top-left on each. Tall left photo tile shows cow with collar and white 230 euros saved per cow headline over dark gradient. Beige tile 3 hours saved daily; blue tile 15% increased production; mint tile up to 30% less ammonia with longer environmental copy; bottom photo tile of hands holding map app with 100% remote headline and gradient overlay. Mixed white and dark text depending on background.
Key takeaway
Quantified ROI bento alternates photography and flat color so metrics feel evidence-based not abstract. Repeated lime icon square unifies disparate tile sizes.
Reuse notes
Strong for ag or ops products with hard savings numbers. Stats must be defensible; photo tiles need real product context not generic farm stock alone.
More bento sections
See all






More like this




Keep what you find
A free account saves references to boards and can send you a weekly email of picks based on what you save.
To see every result, go Pro.