Preview image. Unlock full-res
Left vertical Map Measure Optimize Report word stack with learn-more CTA and right carbon footprint bar chart card.
Summary
Left vertical Map Measure Optimize Report word stack with learn-more CTA and right carbon footprint bar chart card.
Visual description
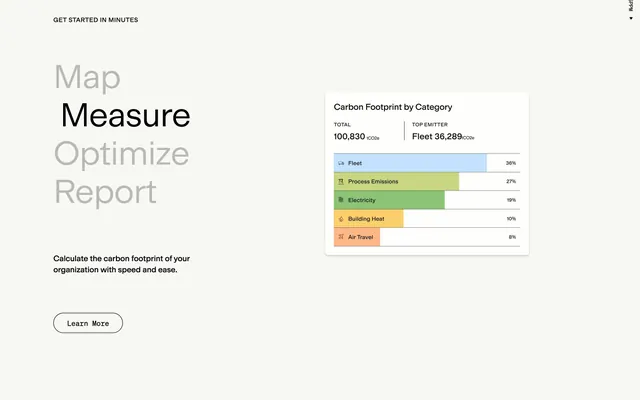
Cream background. Small caps GET STARTED IN MINUTES. Left vertical stack of Map, Measure in black, Optimize, Report in gray with subcopy on carbon footprint calculation and bordered Learn More pill. Right white shadow card titled Carbon Footprint by Category with total 100830 tCO2e, top emitter Fleet, and horizontal bars in blue, lime, green, orange, and coral for Fleet, Process Emissions, Electricity, Building Heat, and Air Travel with icons and percentages.
Key takeaway
Vertical word stack turns a process into typography art with one active step emphasized. Category bar chart with icons makes abstract emissions tangible. Muted cream plus colorful data bars balance enterprise calm and clarity.
Reuse notes
For carbon, analytics, or ops SaaS explaining workflow plus output. Word stack needs one highlighted step updated per scroll state in interactive versions. Chart colors should map to consistent category legend sitewide.