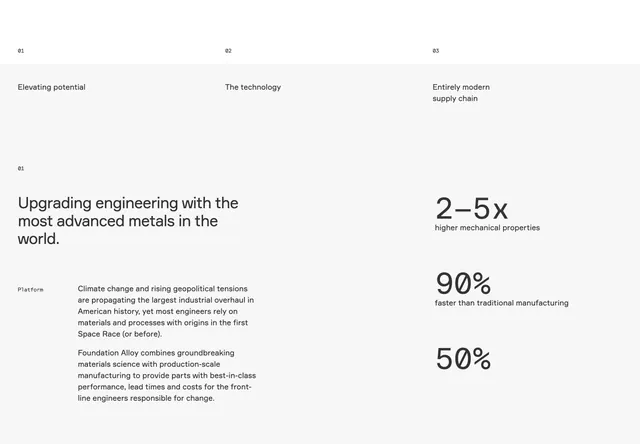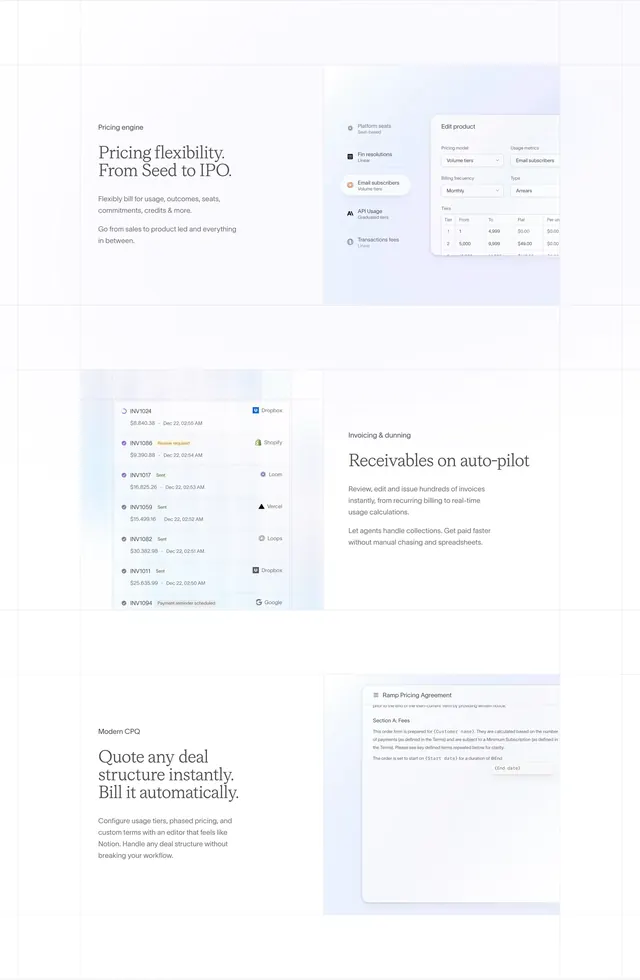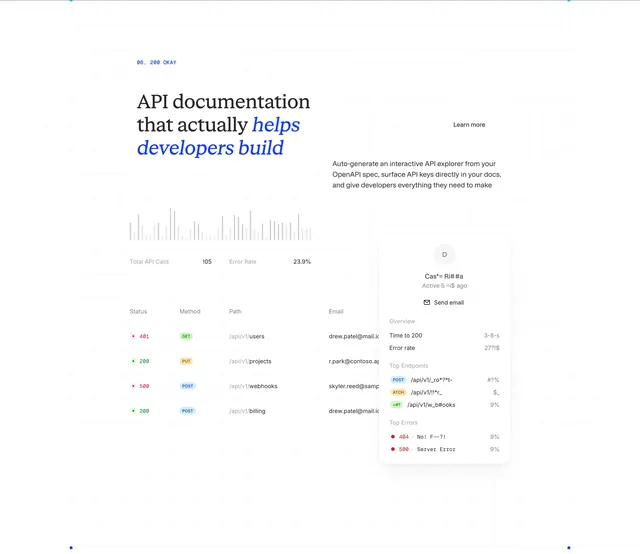
Preview image. Unlock full-res
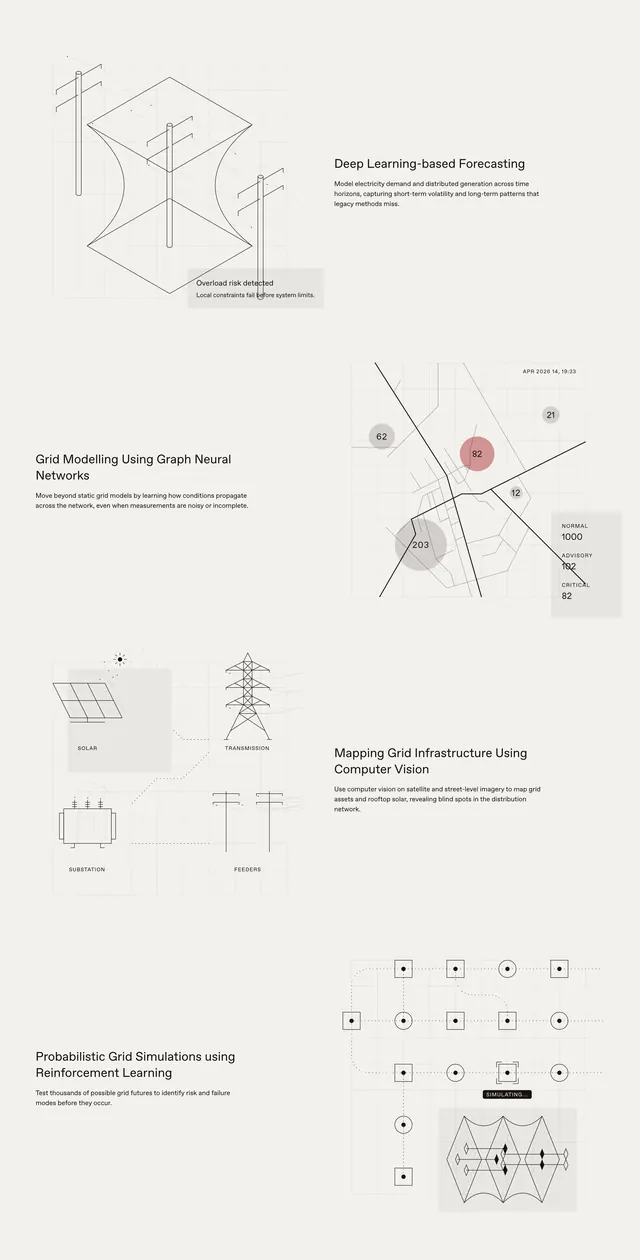
Four stacked capability blocks alternating text and wireframe grid illustrations for forecasting, GNN modeling, CV mapping, and RL simulation.
Summary
A vertical capabilities section with four ML feature rows, each pairing a short paragraph with a technical line-art diagram on a light grid.
Visual description
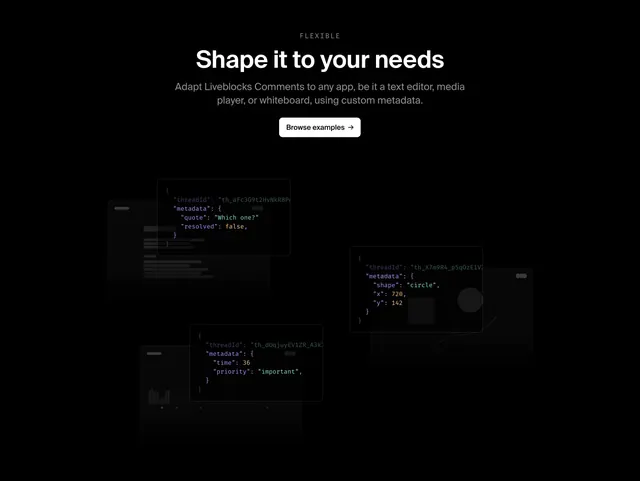
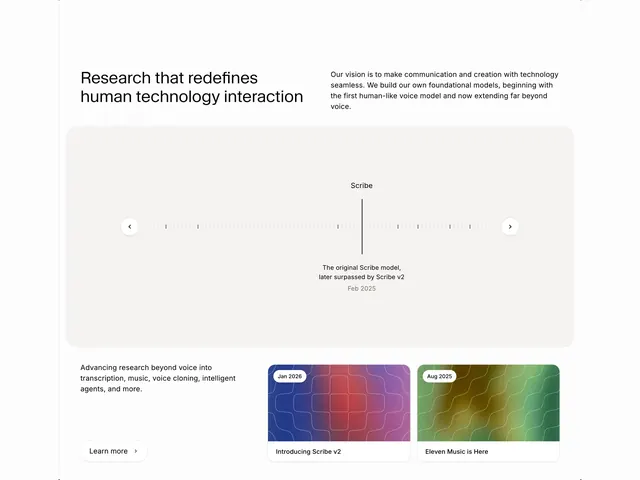
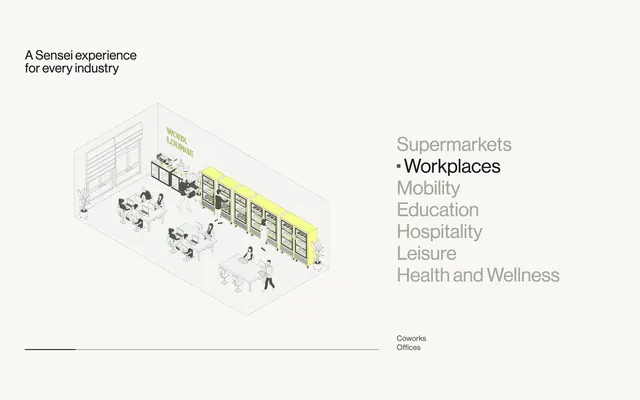
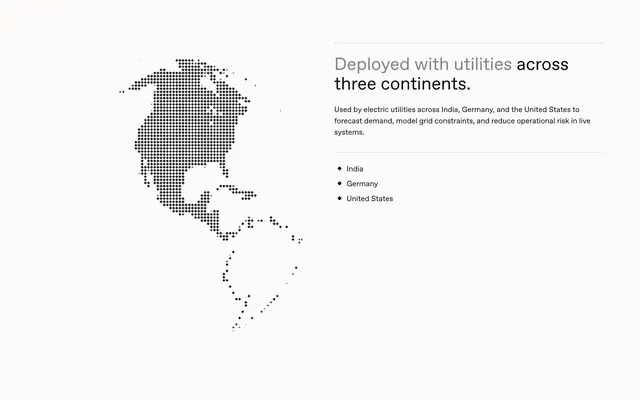
White page with four large blocks stacked vertically, alternating illustration left or right. Block one covers deep learning forecasting with an isometric wireframe shape between utility poles and an overload-risk callout. Block two explains graph neural network grid modeling beside a network map with numbered nodes and a normal/advisory/critical legend. Block three describes computer vision asset mapping with solar, transmission, substation, and feeder icons linked by dotted lines. Block four covers probabilistic reinforcement-learning simulations with a node grid, simulating label, and geometric path diagram.
Key takeaway
Alternating text and diagram sides keeps long technical copy readable while each illustration teaches a distinct concept. Shared grid paper backgrounds unify four different diagrams into one system.
Reuse notes
Reference for AI infrastructure products explaining multiple technical pillars. Each block needs a bespoke diagram; reusing one generic neural-net graphic four times will flatten the narrative.