Preview image. Unlock full-res
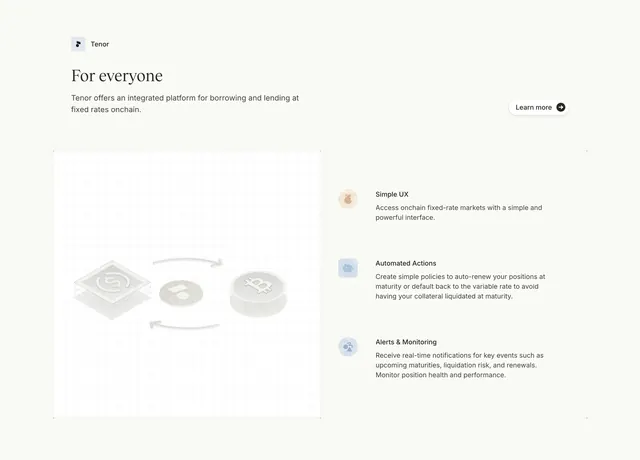
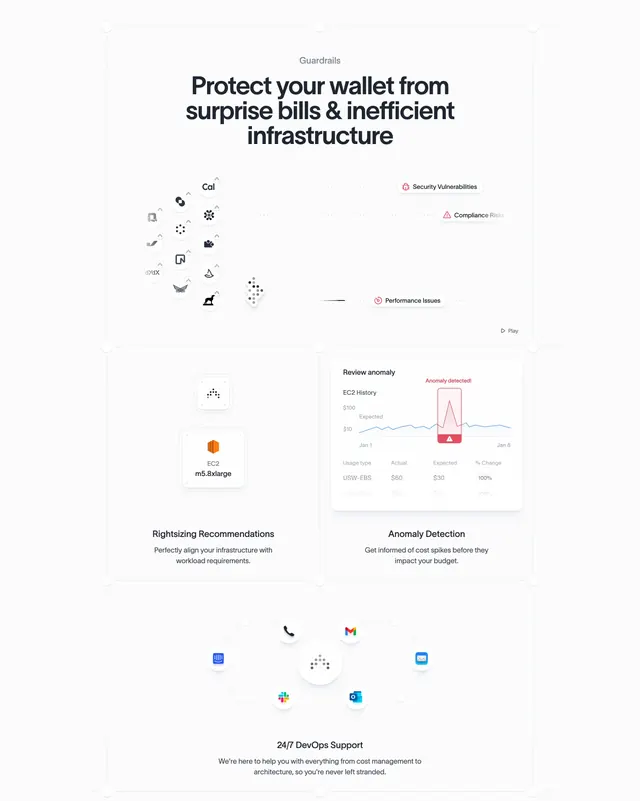
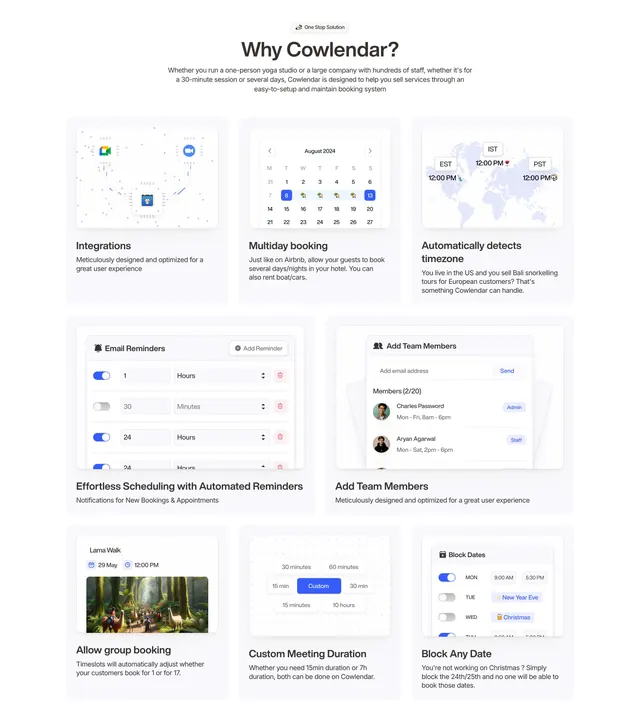
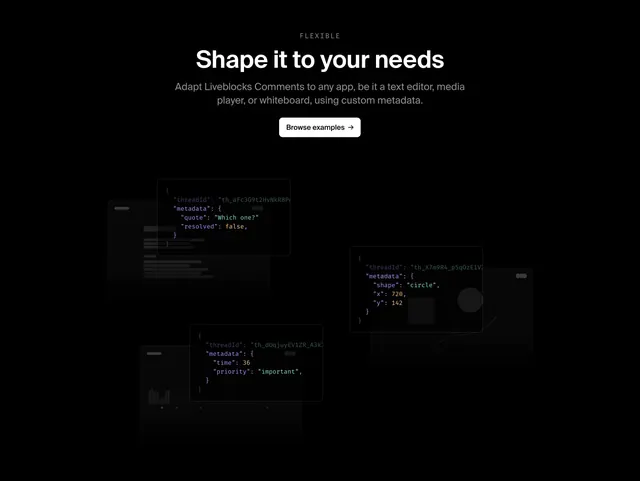
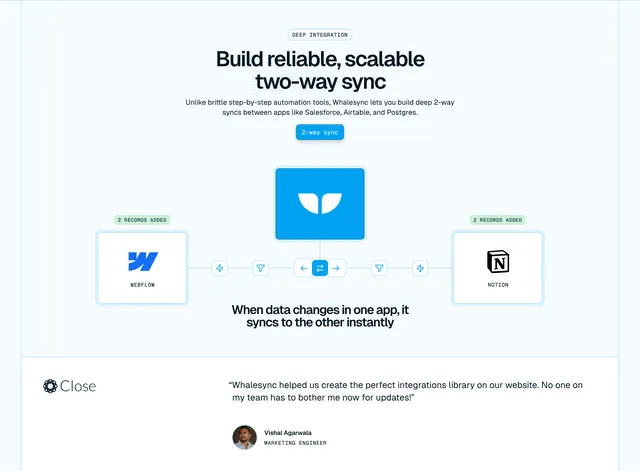
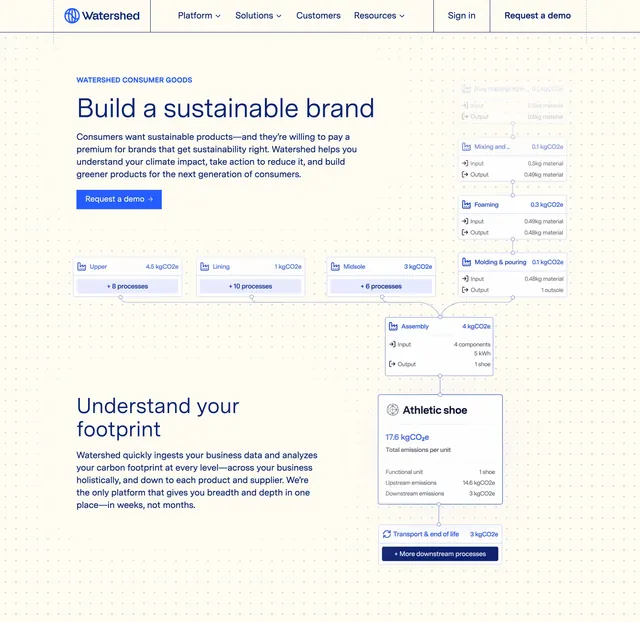
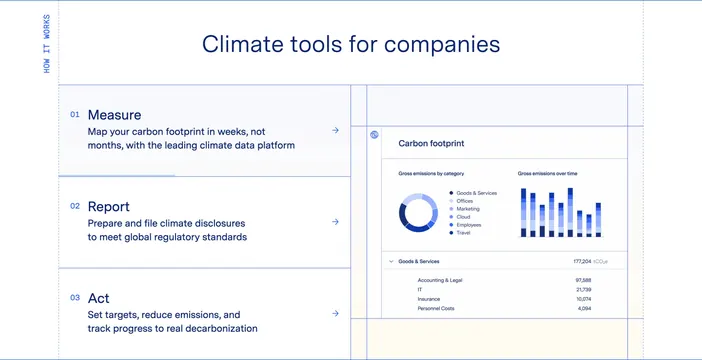
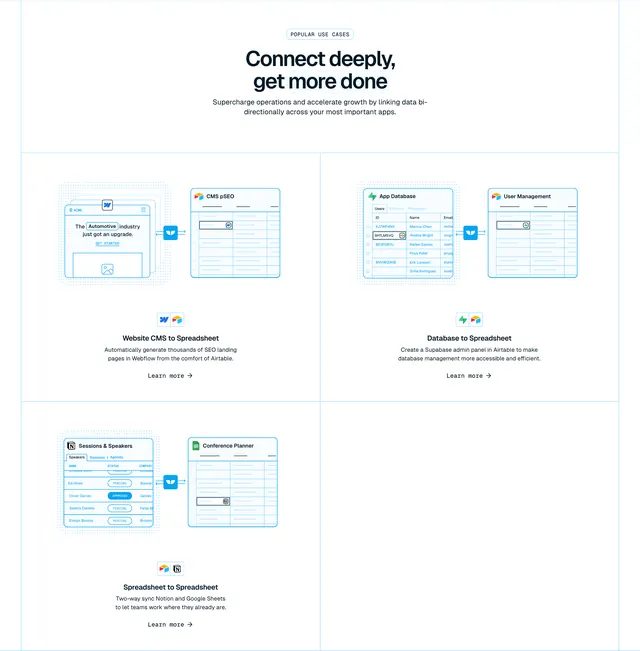
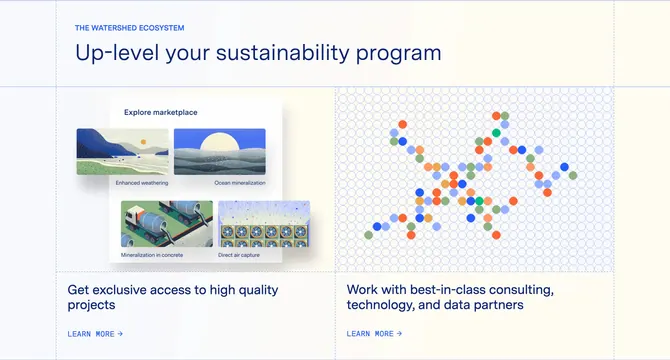
Two-column ecosystem section with marketplace illustration cards and a partner network plotted as dots on a hex grid.
Summary
A split feature explaining the sustainability program through illustrated marketplace cards and a hex-grid partner map.
Visual description
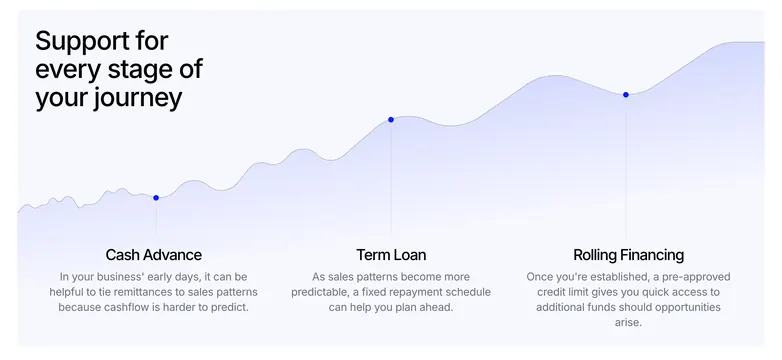
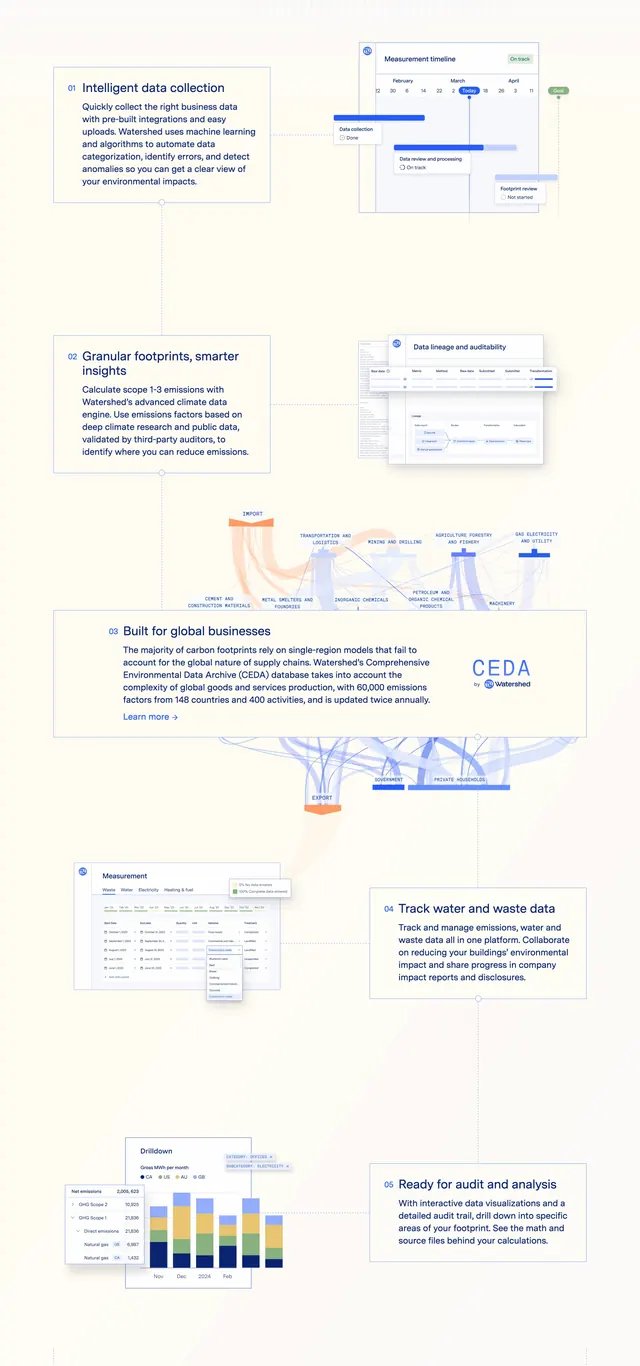
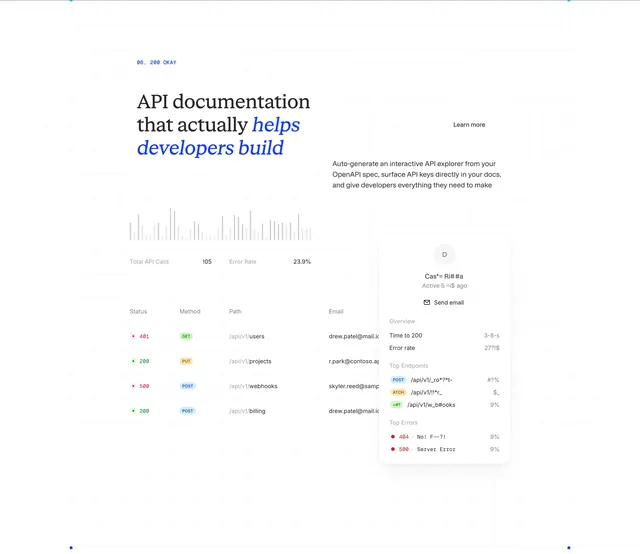
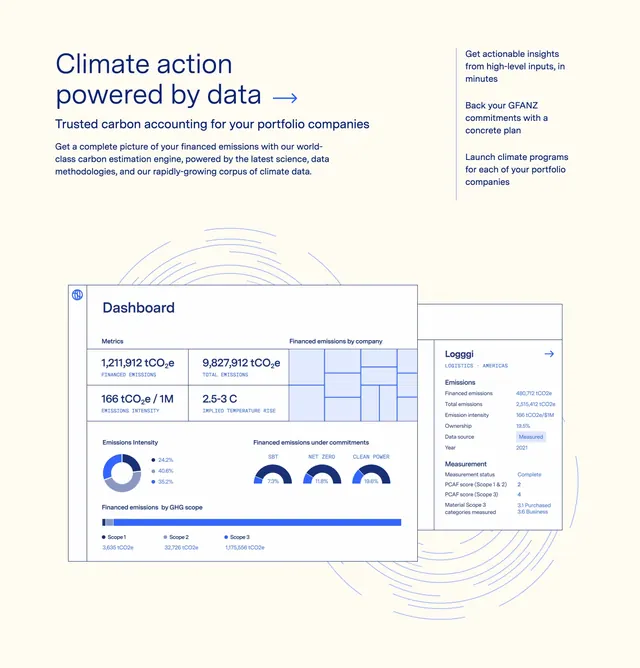
Two-column layout on white. Left column stacks illustration-led cards describing marketplace or program capabilities with soft vector scenes. Right column shows a hexagonal grid background with positioned dots or nodes representing partner network coverage, labeled with concise headings and body copy between visual blocks.
Key takeaway
Pairing product illustration cards with an abstract network map sells both tooling and ecosystem scale. Hex grids feel technical without showing a dense data viz.
Reuse notes
Use when a platform has marketplace plus partner layers. Network dots need a legend or labels to stay readable at smaller breakpoints.