Preview image. Unlock full-res
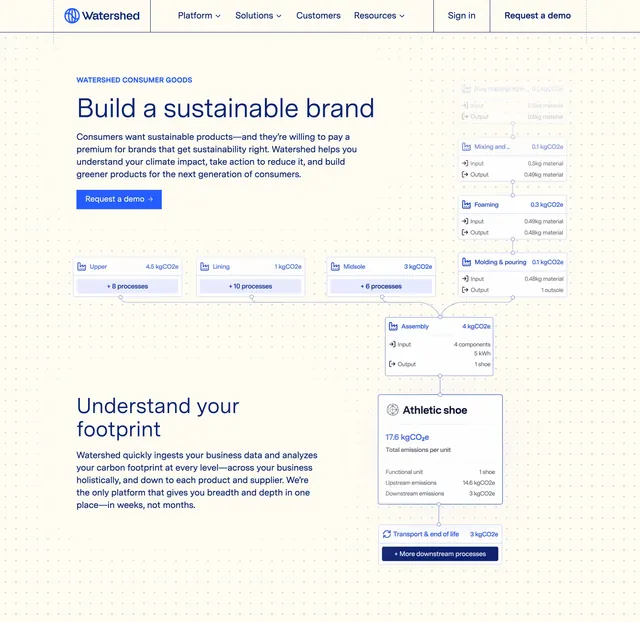
Consumer goods hero with a supply chain flow diagram tracking an athletic shoe through assembly stages and kgCO2e metrics.
Summary
A vertical-specific hero using a product journey diagram to show emissions tracking through consumer goods supply stages.
Visual description
Light background with headline and subcopy on the left about measuring consumer goods emissions. Right side shows a horizontal or stepped flow diagram of an athletic shoe moving through assembly and logistics stages, each node labeled with kgCO2e values or process names. Thin connector lines and small icons keep the diagram readable. Primary CTA below the copy.
Key takeaway
A single product walkthrough makes abstract carbon accounting tangible for merchandising teams. Monospace or numeric labels on nodes reinforce measurement credibility.
Reuse notes
Strong for vertical landing pages (apparel, CPG, retail). Requires accurate product iconography and defensible example numbers.