Preview image. Unlock full-res
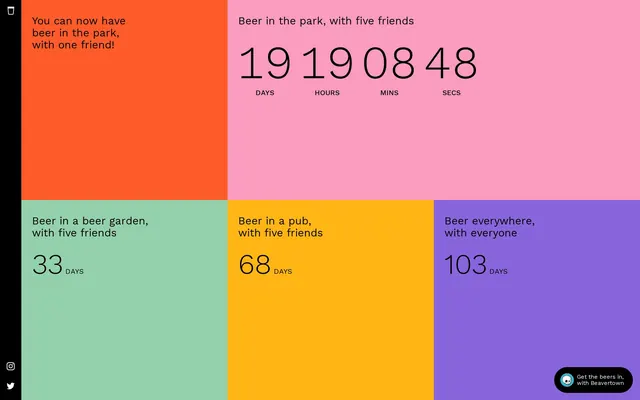
Colorful segmented interface showing beer-related scenarios with countdown timers in a 2x3 grid layout using bright blocks of orange, pink, green, yellow, and purple.
Summary
A vibrant, playful data visualization interface using a colorful 2x3 grid of blocks in contrasting hues displaying beer-related scenarios with countdown timers, suggesting a fun lifestyle tracking or event planning application.
Visual description
A full-screen grid of five large colored blocks on a black background. Top row: orange block (left) with text "You can now have beer in the park, with one friend!" and pink block (right) displaying "Beer in the park, with five friends" with a large countdown timer "19190848" in monospace digits below. Bottom row: mint green block showing "Beer in a beer garden, with five friends" with "33 DAYS," yellow block with "Beer in a pub, with five friends" showing "68 DAYS," and purple block with "Beer everywhere, with everyone" displaying "103 DAYS." Each block uses bold sans-serif typography and clear hierarchical information. Small icons and a "Get the beers in, with Beavertown" button appear in corners.
Key takeaway
Color-coding as information hierarchy tool, using saturation and hue variation to create visual distinction between related data points. The playful, oversized type and bright palette communicate a fun, approachable brand voice. Data visualization that entertains while informing.
Reuse notes
Ideal for lifestyle apps, beverage brand marketing, event planning interfaces, and social apps targeting younger audiences. The playful aesthetic works well for user-friendly SaaS applications, engagement-focused content, and brand marketing campaigns. The grid layout pattern is highly reusable for dashboard design and product visualization.
More like this
Keep what you find
A free account saves references to boards and can send you a weekly email of picks based on what you save.
To see every result, go Pro.