Preview image. Unlock full-res
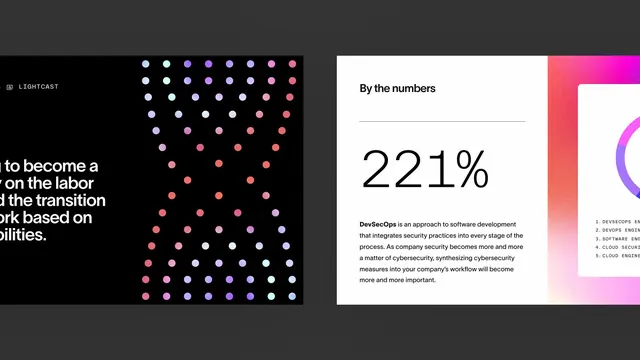
A split-panel infographic pairing a data-driven visual language with a prominent percentage stat and supporting body text, emphasizing security and innovation.
Summary
A split-panel graphic combining a dark left side with a vibrant gradient dot pattern and a clean white right panel anchored by a large percentage stat and explanatory paragraph about DevSecOps.
Visual description
The left panel features a black background with a scattered grid of colored dots (white, purple, magenta, pink, red) arranged in loose rows, creating movement without regularity. Text fragments appear in the upper left. The right panel is pure white, centered on a large sans-serif "221%" in bold black numerals. Above sits the headline "By the numbers" with a thin horizontal rule below it. A substantial paragraph in regular weight sans-serif explains DevSecOps as a software-development approach, with a magenta-to-pink gradient area bleeding off the right edge. A vertical magenta bar separates the two panels, with a partial circular purple-and-magenta gradient graphic visible behind the right panel's edge.
Key takeaway
The scattered dot grid on black creates data-visualization interest without needing actual charts. The sharp contrast between the busy left panel and the spacious right panel guides attention directly to the key statistic. The magenta accent bleeds off-canvas to add visual extension while maintaining focus on the number and supporting text.
Reuse notes
Ideal for DevOps, security, fintech, and technology case studies where one key metric drives the narrative. The gradient dot treatment suggests complexity and data depth without overwhelming. Works well for presentations targeting technical audiences who expect modern, minimal design. The split layout accommodates both a visual anchor and a text block, making it flexible for different stat and copy lengths.
More like this


Keep what you find
A free account saves references to boards and can send you a weekly email of picks based on what you save.
To see every result, go Pro.