Preview image. Unlock full-res
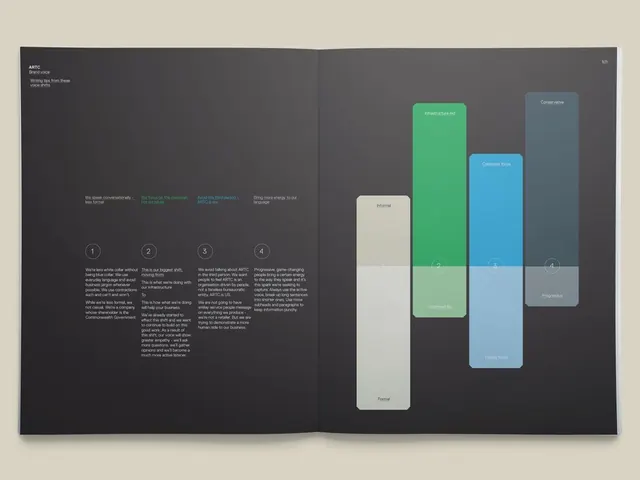
A two-page annual report spread using a four-column layout with alternating vertical bars in teal, blue, and gray on a dark background, pairing sans-serif body text with structured data visualization.
Summary
An ARTC annual report spread dividing information across four vertical colored columns (teal, blue, gray, and neutral) on a dark background, with numbered sections and sans-serif typography driving a sense of structured, data-forward communication.
Visual description
The left page uses a dark gray background with a light beige header section containing "ARTC" and several lines of small sans-serif copy. Below, four numbered sections (1 through 4) are arranged in a grid with descriptive text under each. The right page shows four tall vertical bars in teal, blue, gray, and muted teal, each labeled and containing layered text and labels. The bars create strong rhythm through color contrast and vertical emphasis. Small rounded badge shapes in lighter tones sit at the base of certain bars, labeling categories (Infrastructure, Experimental, Governance, Partnership). All body copy is sans-serif in light gray or white on dark. The overall effect is analytical and calm, emphasizing information architecture over visual drama.
Key takeaway
The vertical bar system creates narrative without relying on traditional columns, allowing text to flow organically around the color divisions. The numbered step pattern on the left pairs naturally with the segmented bars on the right, telling a methodical story. The subtle color palette (teal and blue on gray) avoids jarring contrast while maintaining clear visual hierarchy.
Reuse notes
Ideal for data-heavy reports, quarterly updates, or infrastructure documentation. The vertical-bar pattern works well for timeline, phase, or process communication. Scale the bar widths for different content densities. Pairs well with charts, tables, or diagrams placed inside the bars. Use this for B2B marketing collateral, nonprofit annual reports, or technical documentation where credibility and structure matter more than visual novelty.
More like this

Keep what you find
A free account saves references to boards and can send you a weekly email of picks based on what you save.
To see every result, go Pro.