Preview image. Unlock full-res
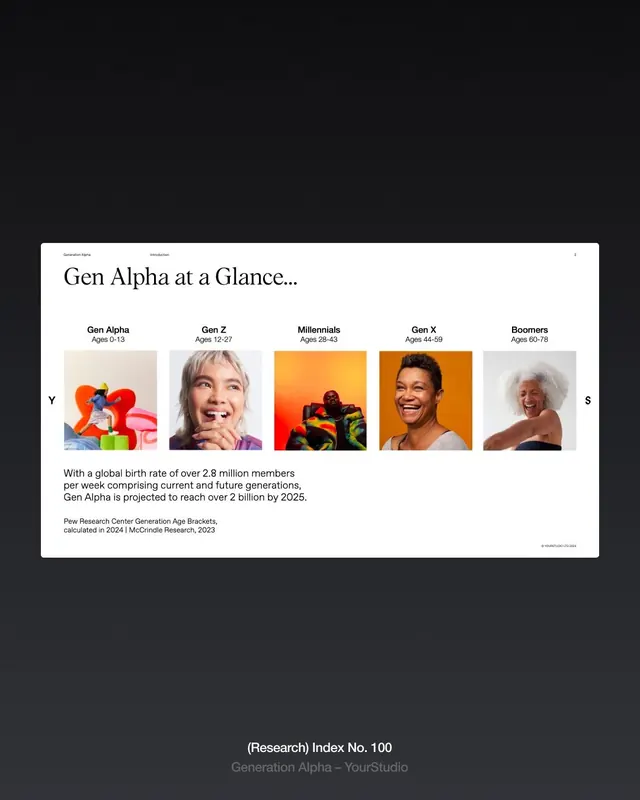
Left-aligned infographic comparing five generational cohorts with colorful portraits, age ranges, and supporting demographic data in a clean, grid-based layout.
Summary
Left-aligned infographic comparing five generational cohorts (Gen Alpha, Gen Z, Millennials, Gen X, Boomers) with their age ranges, colorful portraits, and demographic context in a structured five-column grid.
Visual description
A white card on a dark charcoal background contains five portrait photographs arranged in equal columns, each labeled with a generation name and age range. Gen Alpha features a toy-filled composition in vibrant primary colors; Gen Z shows a young woman against a soft gradient; Millennials display a figure in bold geometric shapes and neon tones; Gen X features a smiling woman on an orange-yellow background; Boomers shows an older woman on a neutral gray. Below the portraits, supporting text states global birth-rate statistics for Gen Alpha, cited to Pew Research Center and McCrindle Research. The type is modern serif for headlines, sans-serif for body copy, aligned left within the card structure. Accent letters Y and S anchor the left and right edges.
Key takeaway
The clear five-part grid rhythm, each column given equal breathing room. The colorful varied portrait treatments (no cookie-cutter sameness) that still feel cohesive within one container. The small, credible data point and citation anchoring the chart's authority without cluttering the visual.
Reuse notes
Strong default for demographic or segmentation reports aimed at business or academic audiences. Works well in presentations, reports, and marketing materials explaining market segments or audience composition. The color variety in portraits prevents monotony while the rigid grid keeps it professional.
More like this







Keep what you find
A free account saves references to boards and can send you a weekly email of picks based on what you save.
To see every result, go Pro.