Preview image. Unlock full-res
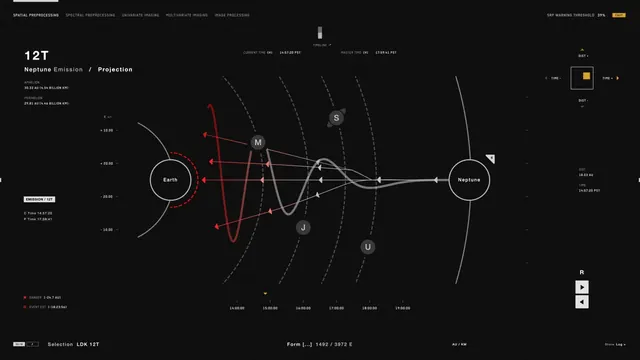
A dark technical diagram mapping planetary orbital trajectories between Earth and Neptune with red vector arrows, orbital paths, and timeline data.
Summary
A dark technical diagram mapping planetary orbital trajectories between Earth and Neptune with red vector arrows, orbital paths, and timeline data.
Visual description
A dark background (nearly black) interface displaying an orbital mechanics diagram. The layout places Earth on the left and Neptune on the right, both as white circles. Red solid and dashed arrows indicate trajectory vectors and orbital paths connecting the planets. Gray dashed orbital rings and curved paths show planetary orbits. Data labels in monospace font identify cardinal points (M, S, J, U for moons or objects), timestamps at the bottom axis (14:00:00 through 19:00:00), and left-side numerical data (altitude/distance in AU). A timeline slider bar appears across the top showing current time, master time, and dist metrics. Yellow and gray accent elements sit in the top-right corner for controls. The composition is left-to-right directional with clustered technical data throughout.
Key takeaway
The red vector system cutting through a monochrome background creates immediate visual hierarchy in a data-dense layout. Using circles to represent planetary bodies and arrows to show trajectories is a clean, literal approach. The combination of gray orbital rings (subtle) with bold red vectors (actionable data) balances information without visual noise.
Reuse notes
Ideal for scientific, aerospace, or technical product interfaces needing to communicate complex spatial relationships. The dark background minimizes eye strain during extended viewing. Works best when the trajectory/vector system is the primary narrative and supporting data (labels, timestamps) plays a secondary role in the margins. Avoid this style for data that needs color differentiation across many variables; the monochrome approach limits that capacity.
More like this

Keep what you find
A free account saves references to boards and can send you a weekly email of picks based on what you save.
To see every result, go Pro.