Preview image. Unlock full-res
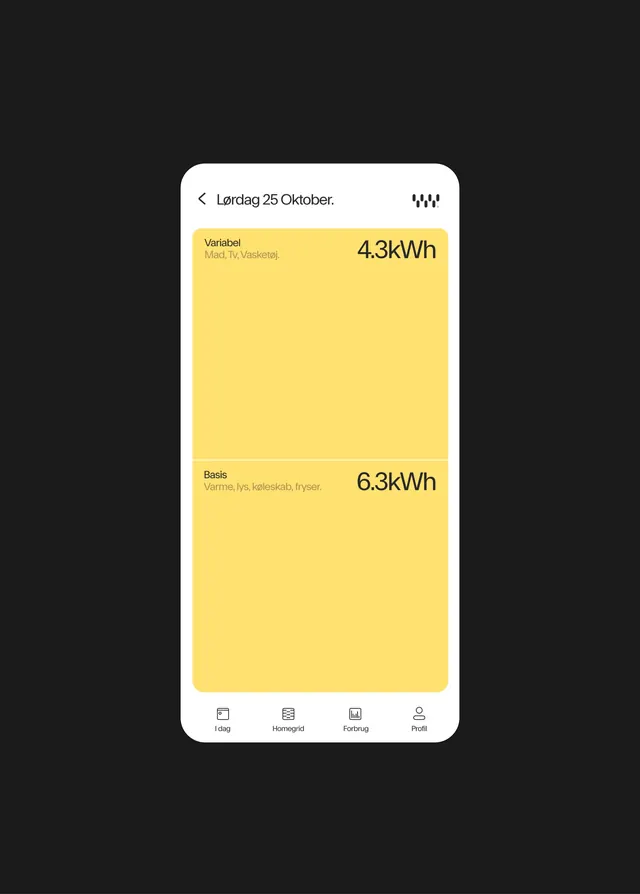
A mobile user interface displaying daily energy consumption data split into 'Variabel' and 'Basis' categories.
Summary
A mobile user interface displaying daily energy consumption data split into 'Variabel' and 'Basis' categories.
Visual description
The screen features a white background with two large, pale yellow rectangular blocks representing data sections. Text is arranged with category labels on the left and large numerical values like '4.3kWh' and '6.3kWh' on the right. A bottom navigation bar contains four simple line-art icons.
Key takeaway
Use large, high-contrast typography for primary data points within soft-colored containers to ensure readability and clarity.
Reuse notes
Use this layout for any consumer-facing application that needs to present simple, daily metrics or status updates.
More like this

Keep what you find
A free account saves references to boards and can send you a weekly email of picks based on what you save.
To see every result, go Pro.