Preview image. Unlock full-res
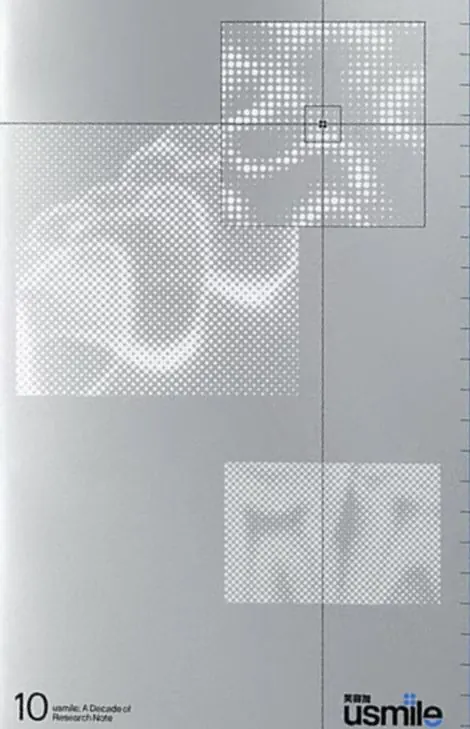
Technical research poster using dense halftone dots and geometric grid overlays to abstract a photographic subject into data-like patterns.
Summary
Technical poster that converts a photographic image into an abstract data visualization using dense halftone dots and intersecting grid lines, creating the visual language of scientific research or documentation.
Visual description
The composition divides into rectangular fields filled with closely-spaced white dots halftoning from black to light gray, separated by thin vertical and horizontal lines forming a precise grid. The dot density varies across regions, creating tonal shifts that suggest an underlying photographic subject. A small axis-marker appears at one intersection, reinforcing the technical, coordinate-based nature of the design. At bottom left, sans-serif text reads "10 jourdes: A Decade of Research-Note" with a small logo at bottom right, anchoring it as a publication cover or poster. The overall effect is clinical and impersonal, emphasizing the abstraction of data over representation.
Key takeaway
The technique of converting a photograph into halftone dots layered over a visible grid creates instant technical credibility and transforms documentary imagery into something analytical and scientific. The sparse typography and compact logo placement maintain focus on the graphic surface. The color restraint (grayscale only) strengthens the research/academic tone.
Reuse notes
Excellent for research publications, academic posters, scientific documentation design, and retrospectives that want to feel rigorous. The halftone-plus-grid language signals data and systematic thinking. Works best with clear, readable imagery underneath (the dots must resolve the underlying subject enough to be legible). Size up for print impact.
More like this

Keep what you find
A free account saves references to boards and can send you a weekly email of picks based on what you save.
To see every result, go Pro.