Preview image. Unlock full-res
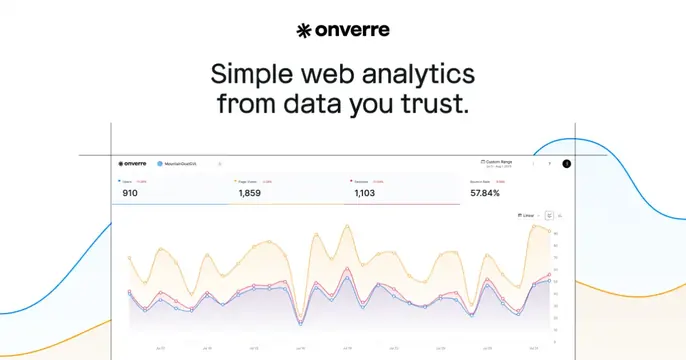
Light OG card with a centered wordmark and headline on a pale gradient above an analytics dashboard screenshot bleeding off the bottom.
Summary
A light OG card that centers a wordmark and headline over a pale pink-to-lavender gradient, then anchors the lower half with an analytics dashboard full of charts bleeding off the bottom. The clean centered type over a real metrics dashboard is the defining structure.
Visual description
A soft gradient background washing from pale pink into light lavender. Centered up top sits the black "ChartMogul" wordmark, and below it a two-line black sans-serif headline, "CRM & Subscription Analytics built for B2B SaaS growth." The lower half is filled by a screenshot of the ChartMogul dashboard with a dark left sidebar and a grid of cards: MRR-by-channel bar charts, ARR cohort figures, a Q3 target, retention-rate line charts and an activity feed. The dashboard is cropped off the bottom so it reads as live software.
Key takeaway
Centering clean type over a barely-there pastel gradient to keep focus on the message, then proving the product with a dense dashboard bled off-canvas. The restrained two-color gradient signals calm and trustworthiness for an analytics tool.
Reuse notes
A dependable pattern for any analytics, metrics, or BI SaaS where the dashboard is the product. Chart detail vanishes when shrunk, so the wordmark and headline must carry recognition at thumbnail size. The pale gradient keeps it professional rather than flashy.