Preview image. Unlock full-res
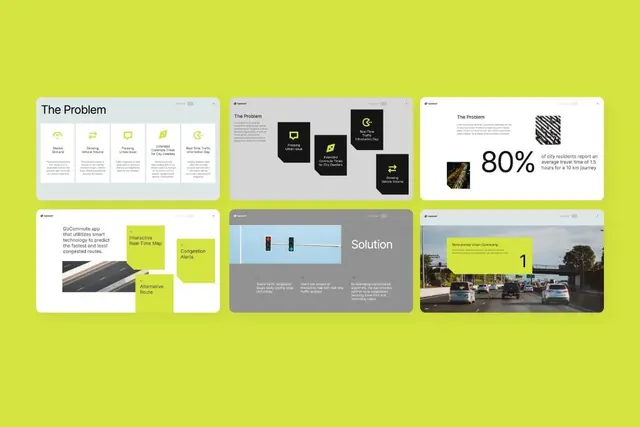
Six UI mockup panels on a vibrant lime-green background, organized in a 2x3 grid, each showing problem statement, solution diagram, or on-ground impact for a city transit app.
Summary
Six presentation boards laid out in a bento grid on a lime-green background, illustrating an urban mobility solution with problem icons, system diagrams, statistics, and street-level photography.
Visual description
A 2x3 grid of card-style mockups floats against a saturated lime-green background. Top-left card has the headline "The Problem" with five icon-and-label pairs describing urban transit issues (market size, driving options, public transit, express options, real-time data). Top-center shows black cards on a darker background with branded elements. Top-right pairs "The Problem" headline with a large "80%" stat and explanatory body text, plus a striped pattern and street photograph. Bottom-left combines a road photograph with "DrCommute app" text and "Interactive Real-Time Map" label in a bright yellow box over green area. Bottom-center displays a schematic diagram in shades of blue labeled "Solution" with three supporting text blocks. Bottom-right shows "Solution" headline with a photograph of a busy street and a bright lime-green "1" badge overlay. All cards use white or light gray backgrounds except the stylized diagram card. Typography is sans-serif throughout, set in dark gray or black.
Key takeaway
The lime-green surround energizes the entire presentation while the individual cards stay quiet with white backgrounds, creating emphasis hierarchy. The mix of icon systems, diagrams, statistics, and environmental photography tells a complete story without relying on blocks of copy. The colored accent boxes and badge labels provide scannable entry points.
Reuse notes
Ideal for b2b or civic tech pitch decks where you need to communicate a problem clearly, visualize the solution system, and prove impact with data and real-world context. The card-based grid scales well to varying content lengths and formats. Works best when you have strong photography or custom diagrams to anchor the solution sections; use caution if your visual assets are weak.