Preview image. Unlock full-res
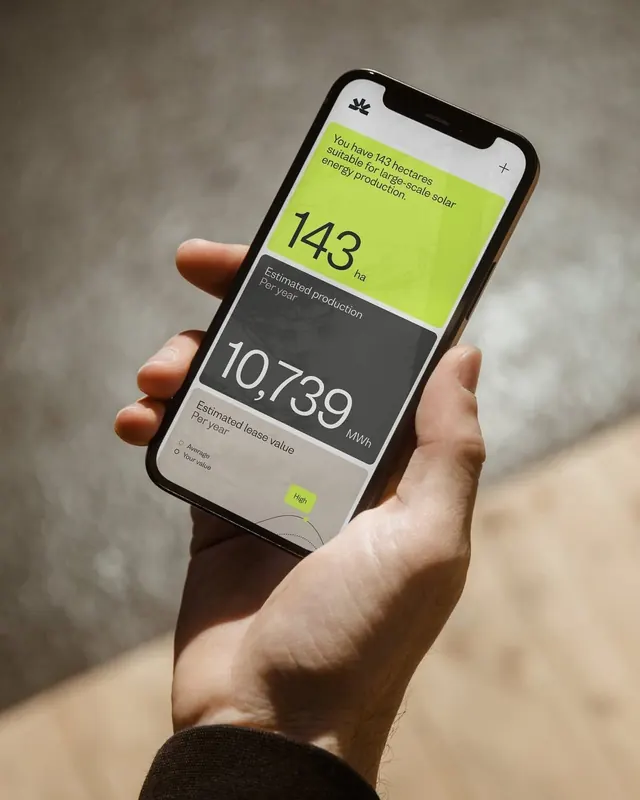
A smartphone screen shows a mobile app interface with three stacked cards displaying land area and estimated solar production metrics.
Summary
A smartphone screen shows a mobile app interface with three stacked cards displaying land area and estimated solar production metrics.
Visual description
A hand holds a smartphone at a slight angle against a blurred outdoor background. On the screen is a clean app UI with a white header, a bright lime top card, a dark gray middle card, and a light beige bottom card, each containing large numeric readouts and short labels.
Key takeaway
Use bold oversized numerals inside stacked color-block cards to make key metrics instantly scannable. The restrained palette and generous spacing give the interface a premium, analytical feel.
Reuse notes
This works well for product screens that need to present a few high-value KPIs with clear hierarchy. It is especially useful when the goal is to make technical data feel simple and persuasive.