Preview image. Unlock full-res
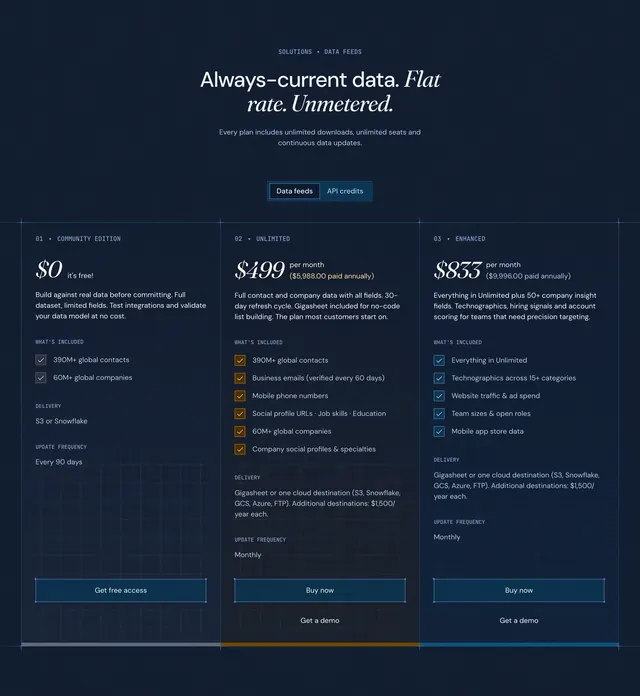
Dark three-tier pricing section with a data feeds versus API credits toggle, grouped inclusions, and blueprint-bordered plan columns.
Summary
Dark three-tier pricing section with a data feeds versus API credits toggle, grouped inclusions, and blueprint-bordered plan columns.
Visual description
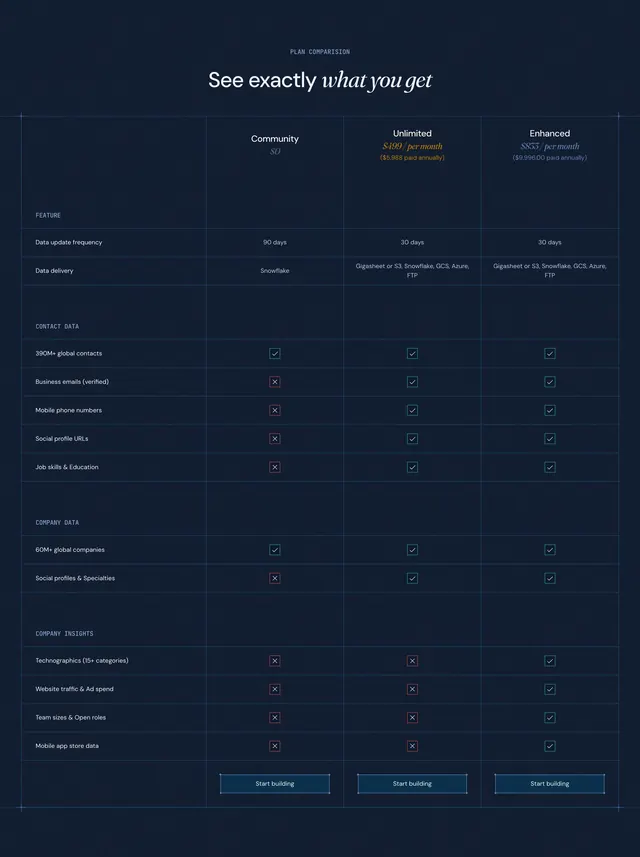
Centered header on a dark navy blueprint grid: SOLUTIONS and DATA FEEDS eyebrow, large headline Always-current data. Flat rate. Unmetered. with the second clause in italic serif, and a one-line value prop about unlimited downloads and seats. A pill toggle switches Data feeds (active, filled) and API credits (outline). Three bordered columns follow: 01 Community Edition at $0 with two included data counts and 90-day refresh; 02 Unlimited at $499 per month highlighted with gold annual pricing, six checked features, monthly refresh, and a Buy now button plus Get a demo link; 03 Enhanced at $833 with insight-field bullets and matching CTAs. Each column sections What's included, Delivery, and Update frequency behind thin grid lines with crosshair corner marks.
Key takeaway
Blueprint grid borders make pricing cards feel like spec sheets rather than marketing tiles. A product-mode toggle above the tiers lets one layout serve two purchase paths. Calling out the middle tier as the default starting plan nudges choice without a loud badge.
Reuse notes
Works for flat-rate B2B data or API products with clear tier stair-steps. The toggle pattern suits businesses selling both bulk feeds and metered credits. Dense copy per column needs generous width; verify mobile stacking still preserves hierarchy.