Preview image. Unlock full-res
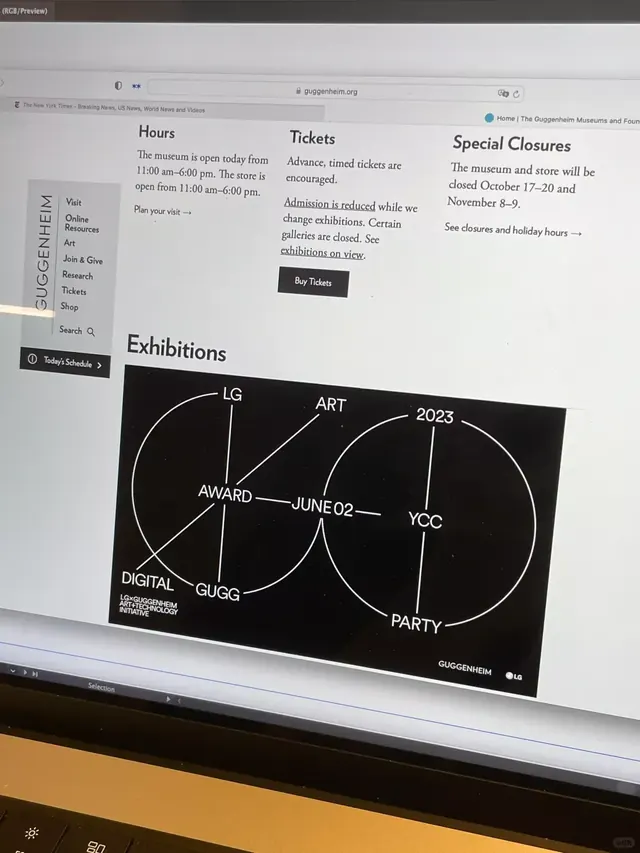
Guggenheim Museum website interface enhanced with an overlaid circular diagram mapping exhibition data and event metadata.
Summary
Museum website landing page overlaid with a technical circular diagram showing exhibition structure, event dates, and curatorial categories through node-and-line information design.
Visual description
Guggenheim Museum website screenshot showing two primary information zones. Upper section displays institutional copy in serif and sans-serif on off-white background: a left vertical navigation menu (Visit, Online Resources, Art, Join & Give, Research, Tickets, Shop, Search) and three stacked content columns (Hours, Tickets, Special Closures) with linked copy in dark grey serif. Lower section features a large dark/black rotated rectangle containing a white-line circular diagram. The diagram uses concentric and intersecting circles with radial connecting lines and labels: outer ring segments labeled LG, ART, 2023, YCC, PARTY, while inner nodes show DIGITAL, GUGG, AWARD, JUNE 02 with Guggenheim and LG logos at bottom corners. Typography is sans-serif all-caps in white on black. The layout treats the diagram as a bold visual assertion breaking the institutional reserve of the upper copy area.
Key takeaway
Circular diagrams with intersecting relationship lines compel attention and convey information hierarchy through node prominence and label density without traditional bar/pie chart formality. White line-art on dark background creates high contrast and reads at any scale. Rotating information graphic at an angle creates visual momentum within a static layout. Pairing rigid sans-serif labels with curved geometry balances geometric and organic.
Reuse notes
Excellent for exhibition calendars, event relationship maps, or complex category structures. Works especially well for cultural institutions, museums, galleries, and educational sites seeking sophisticated data viz. Circular layouts suggest cyclical/recurring content (seasons, festivals, series). Best when circles/intersections have semantic meaning (not decorative). Requires legible label placement; dense diagrams need larger scale or simplified node count for mobile/small screens.
More like this

Keep what you find
A free account saves references to boards and can send you a weekly email of picks based on what you save.
To see every result, go Pro.