Preview image. Unlock full-res
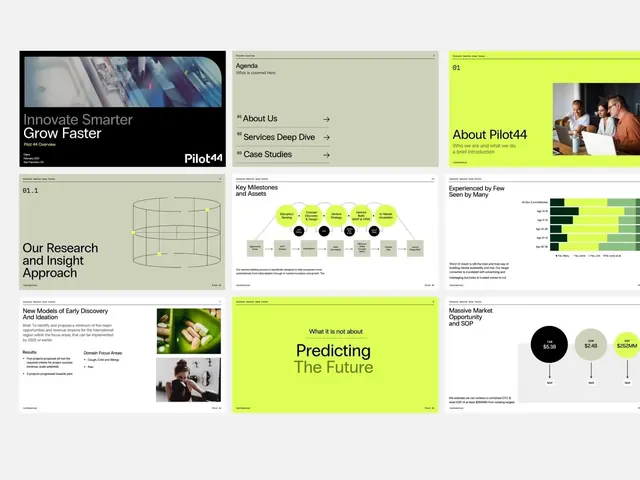
Multi-slide presentation deck using a beige-and-lime color system to separate informational blocks and data visualizations across a structured grid layout.
Summary
A business presentation system using high-contrast lime green and warm beige to organize a complex research narrative into discrete, scannable sections across multiple slides.
Visual description
The deck spreads across nine visible slides in a grid layout. The cover slide features a dark video frame over black, with layered text reading "Innovate Smarter / Grow Faster" in white sans-serif. The agenda slide uses a beige card layout with numbered sections ("01 About Us", "02 Services Deep Dive", "03 Case Studies") separated by rule lines. A key-milestones slide introduces a process diagram with lime-green and dark pills connected by lines, showing a linear workflow. A lime-green section divider announces "About Pilot44" with an image of three people in a meeting. A lime-green heat-map slide ("Experienced by Few, Seen by Many") uses stacked color bars to show time ranges and sentiment. A grid-based research-approach slide uses geometric line-work over beige. The lower slides show market-opportunity data with three large circles containing financial figures, plus a slide mixing photography with typography for narrative.
Key takeaway
The disciplined color boundary between beige information space and bright lime accent bars for emphasis and visual rhythm across many slides. The process diagram using dark pills on lines with connecting arrows to show sequential steps. The layered approach to mixing photography, typography, and data visualization within a single consistent frame.
Reuse notes
Effective template for consulting decks or business reports needing to communicate research, process, market opportunity, and qualifications across 9-12 slides. The lime-on-beige system maintains energy without oversaturation. Works best when content density varies deliberately: some slides are dense grids, others are spacious with a single image or statistic.
More like this

Keep what you find
A free account saves references to boards and can send you a weekly email of picks based on what you save.
To see every result, go Pro.