Preview image. Unlock full-res
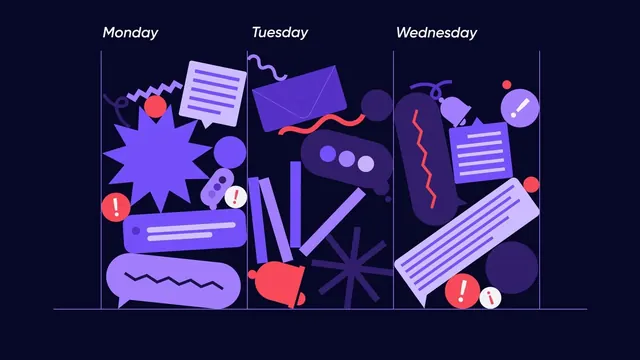
A flat vector illustration organized as a three-column weekly timeline spanning Monday through Wednesday, populated with stylized task and productivity icons in vibrant purple and red accents on a dark navy background.
Summary
A weekly project-planning timeline in flat illustration style, divided into three columns showing Monday, Tuesday, and Wednesday tasks represented by layered vector icons, geometric shapes, and accent elements.
Visual description
A dark navy background frames three vertical columns separated by thin vertical dividers. Each column is labeled with a day (Monday, Tuesday, Wednesday) in italic sans-serif at the top. Within each column, various flat vector elements overlap: a large purple star burst, checklist icons with striped detail, speech bubbles with exclamation marks, horizontal bars, circles in varying tones of purple and lighter violet, wavy lines in coral-red accent, and geometric shapes suggesting mail, notifications, and task indicators. The purple color palette ranges from deep violet to light lavender, with bright red-coral serving as a secondary accent. Icons are stacked and layered to create visual rhythm and imply accumulating tasks or scheduled items across the week.
Key takeaway
The use of a three-column grid structure for weekly or daily scheduling without requiring a calendar widget. Flat, playful icons combined with simple geometric shapes to represent abstract concepts like communication, tasks, and notifications. The cool purple-navy palette with warm coral accents creates visual energy and hierarchy while maintaining a calm, approachable tone.
Reuse notes
Effective for productivity software, project management tools, content planning, and onboarding illustrations. The column structure scales well to different weeks or time periods. The flat style suits app interfaces and marketing graphics equally. Best used when the background is kept dark to maintain the cool, focused mood. The overlapping icon treatment can feel busy, so it works well at larger sizes and for illustrative rather than dense data display.
More like this





Keep what you find
A free account saves references to boards and can send you a weekly email of picks based on what you save.
To see every result, go Pro.