Preview image. Unlock full-res
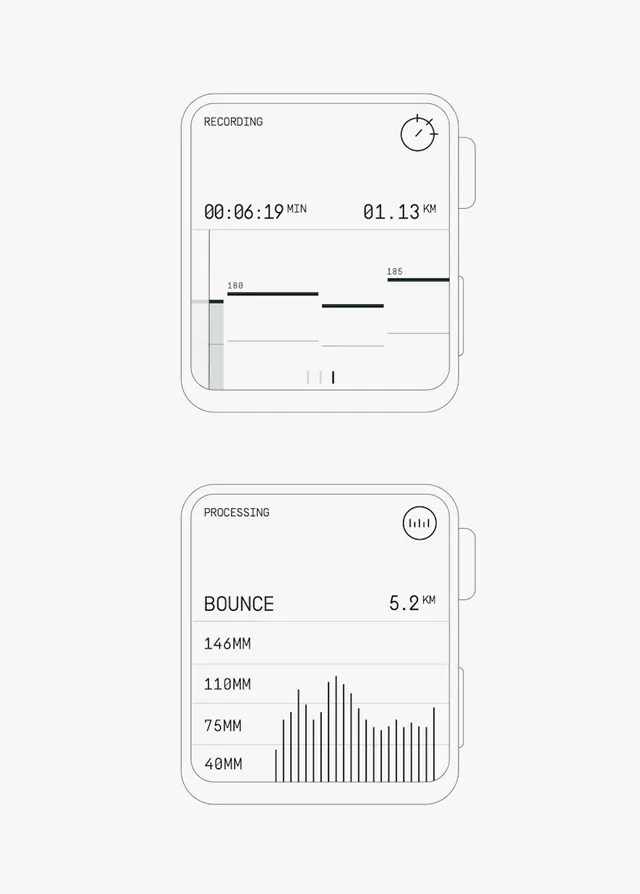
Two smartwatch interface designs displaying live workout metrics in a minimalist monochrome style: one showing duration and distance, the second showing bounce and impact depth data.
Summary
Two smartwatch interface designs showing live workout metrics in a minimal, high-contrast monochrome style. The "Recording" screen displays time elapsed and distance covered; the "Processing" screen shows bounce measurement and a frequency histogram of impact depth.
Visual description
Two stacked smartwatch UI frames on a light beige background, each with rounded borders and a physical handle on the right side. The top frame labeled "RECORDING" displays two key metrics side-by-side: elapsed time (00:06:19 MIN) and distance (01.13 KM), with a stopwatch icon in the top-right corner. Below is a horizontal bar chart with three thick black bars showing step cadence or pace intervals, with gray reference lines. The bottom frame labeled "PROCESSING" shows "BOUNCE" as the primary metric (5.2 KM) and a vertical bar chart displaying frequency distribution across height measurements (146MM, 110MM, 75MM, 40MM) with a waveform-like icon in the top-right. The typography is clean, monospace numerals for data, and sans-serif labels, all in black on white with minimal gray accents.
Key takeaway
The dual-metric layout efficiently showing both primary and secondary data without clutter. The horizontal and vertical bar charts use consistent visual language and scale, making performance data scannable at a glance. The monochrome palette with strategic icon placement keeps the interface austere and focused on information hierarchy.
Reuse notes
Ideal for fitness apps, running trackers, health-tech dashboards, or any performance-monitoring interface where real-time data must remain legible in a compact space. Works well for wearable or mobile screens. The grid-based structure and monospace numbers suit any metric-heavy context (sports, analytics, logistics).
More like this



Keep what you find
A free account saves references to boards and can send you a weekly email of picks based on what you save.
To see every result, go Pro.