Preview image. Unlock full-res
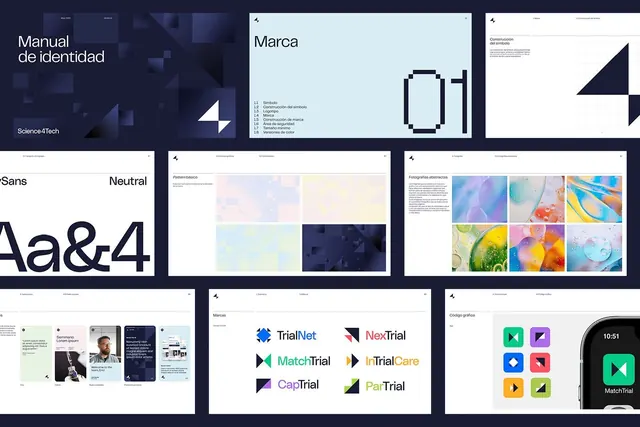
A dark dashboard interface composed of rounded rectangular tiles with blue-to-orange gradient fills, some containing minimal icons, arranged in a uniform grid pattern.
Summary
A dark dashboard composed of rounded rectangular tiles with gradient fills transitioning from cool blue to warm orange, arranged in a grid with some tiles bearing minimal line icons.
Visual description
A grid of rounded rectangular tiles on a very dark navy background, each filled with a smooth gradient blend of cool blue and warm orange hues at varying saturation levels and opacity. Most tiles are solid gradient; some contain subtle line icons in monochromatic white or light purple, including a small letter "A" with a symbol, a simplified image frame, and bar chart elements. The tiles are evenly spaced and sized, creating a modular, press-glass effect with the dark negative space between them emphasizing the layered dimensionality.
Key takeaway
The gradient-tile grid as a dashboarding pattern: clean modularity with visual depth from color gradients and opacity shifts. The restrained iconography (line-only, monochromatic) keeps individual tiles scannable without clutter. The consistent rounded corners and gap create the appearance of floating, interactive elements.
Reuse notes
Ideal for data dashboards, analytics interfaces, or control panels where color coding and modularity matter. Works best on dark backgrounds; the cool-to-warm gradient feels premium and contemporary. Consider using this for displaying status, metrics, or feature shortcuts in SaaS or developer tools.