Preview image. Unlock full-res
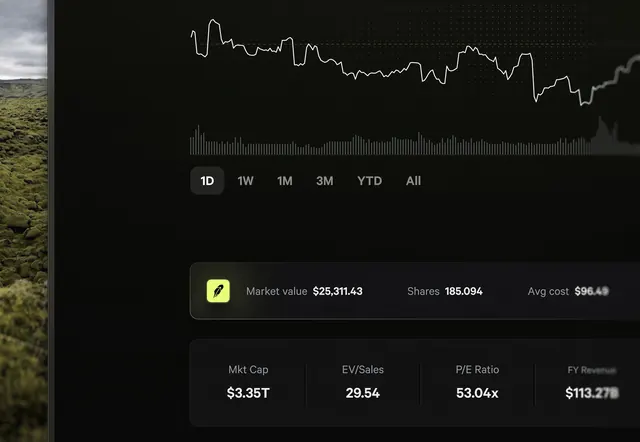
A shallow-focus close-up of a dark-mode investing app showing a line chart, portfolio stats, and market metrics.
Summary
A tilted phone or screen shows a financial dashboard in near-black tones. A white line chart, portfolio summary card, and key valuation stats stack vertically inside rounded containers.
Visual description
The upper area holds a dotted-grid line chart with volume bars and a 1D/1W/1M timeframe selector. Below, a card shows market value, share count, and average cost beside a small green square icon with a feather mark. The bottom card lists mkt cap, EV/sales, P/E ratio, and FY revenue in columnar white type. Shallow depth of field blurs the right edge while a sliver of an outdoor landscape appears at the far left.
Key takeaway
The interface keeps dense financial data readable through dark surfaces, tight typographic hierarchy, and one bright accent on the portfolio card.
Reuse notes
Useful for fintech dashboard references, dark trading app UI, and chart-plus-metrics layouts. The angled product shot also works for device mockup direction with selective focus.