Preview image. Unlock full-res
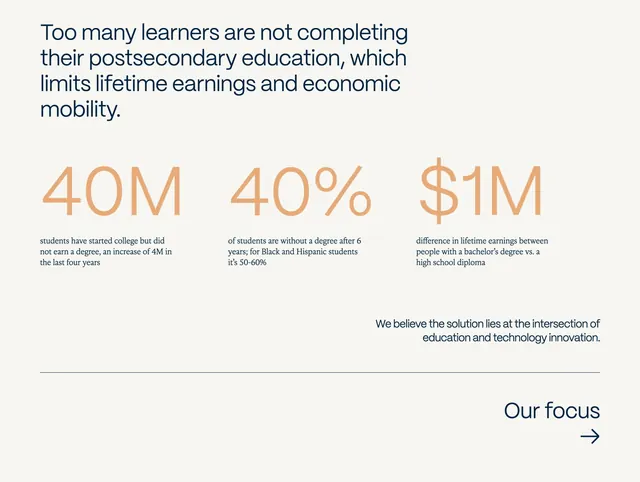
Cream impact section with problem headline and three peach oversized stats on completion gaps and lifetime earnings.
Summary
A data-led problem section cites 40M incomplete degrees, 40% six-year non-completion, and $1M earnings gap beneath a navy headline on cream.
Visual description
Off-white background with large navy sans headline top left on learners not completing postsecondary education. Center row shows three peach oversized numerals 40M, 40%, and $1M with serif explanatory paragraphs on dropout scale, equity gaps for Black and Hispanic students, and bachelor's versus high school earnings. Bottom right holds navy mission line on education and technology innovation. Full-width thin rule at base with Our focus text link and arrow right-aligned below.
Key takeaway
Colored oversized numbers turn dense policy data into scannable anchors. Asymmetric placement (headline left, stats center, thesis right) builds a narrative arc in one screen.
Reuse notes
Strong for nonprofit, edtech, or impact reports establishing urgency before solutions. Limit to three stats to preserve whitespace; ensure serif body stays readable at smaller sizes.
More stats sections
See all

More like this





Keep what you find
A free account saves references to boards and can send you a weekly email of picks based on what you save.
To see every result, go Pro.