Preview image. Unlock full-res
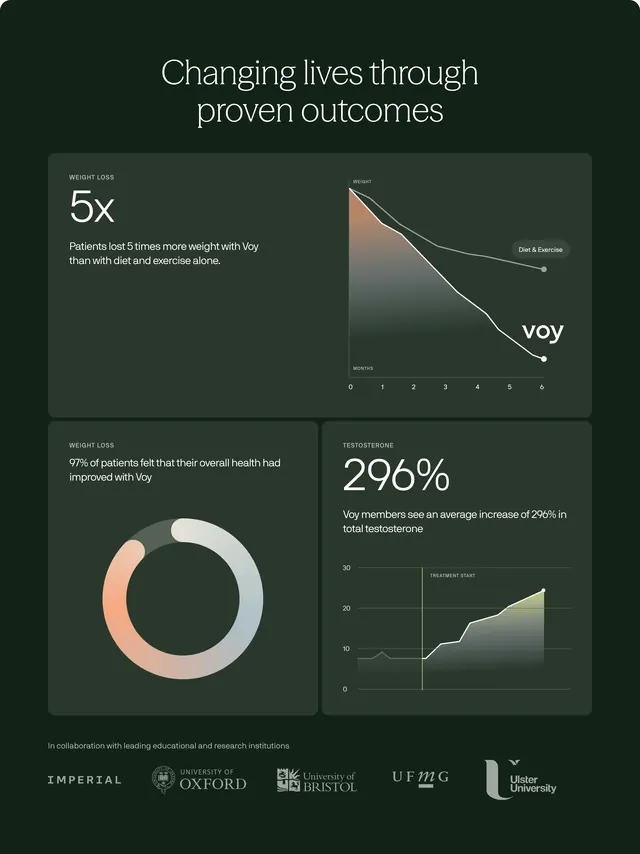
Dark green stats section with weight-loss comparison chart, patient sentiment donut, testosterone spike graph, and university logos.
Summary
A dark data bento proving clinical outcomes through comparison charts, satisfaction percentages, and testosterone lift metrics plus academic partners.
Visual description
Deep forest green background. White centered headline "Changing lives through proven outcomes." Top full-width white rounded card: left shows large "5x WEIGHT LOSS" stat with copy about Voy vs diet alone; right line chart compares shallow "Diet & Exercise" decline to steep "voy" line over six months with peach-to-gray gradient fill. Bottom left card: "97% of patients felt that their overall health had improved" with large donut chart. Bottom right card: "296% TESTOSTERONE" average increase with line chart spiking after "TREATMENT START" marker and gradient fill. Footer line "In collaboration with leading educational and research institutions" above white university logos (Imperial, Oxford, Bristol, UFMG, Ulster).
Key takeaway
Bento layout lets multiple claims coexist without a long scroll of copy. Gradient-filled chart areas brand data visualization consistently on dark fields.
Reuse notes
For health or fintech with substantiated metrics. Every stat needs legal substantiation; dark sections break up long light pages effectively.