Preview image. Unlock full-res
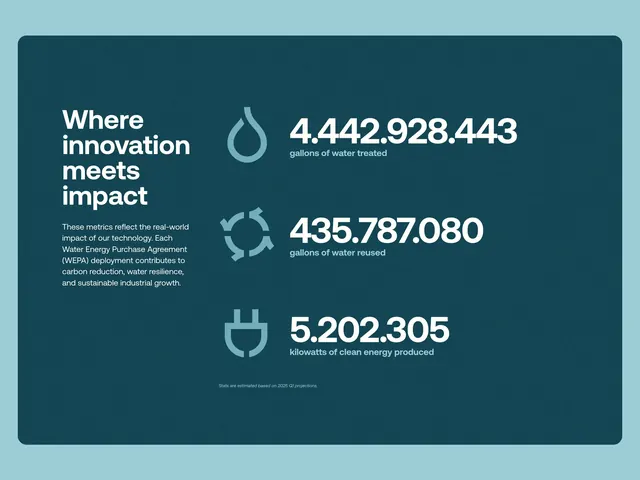
Dark teal stats card with left headline on WEPA impact and three large icon metrics for gallons treated, reused, and clean energy kilowatts.
Summary
Where innovation meets impact split card: left copy on WEPA deployments, right three rows of pale icon plus massive number and label for water treated, reused, and energy produced.
Visual description
Light cyan page background. Large rounded dark teal card. Left column: headline and paragraph tying metrics to carbon reduction and water resilience. Right: three metric rows each with large outline icon (droplet, recycle arrows, plug), bold pale number with period thousands separators (4.442.928.443 gallons treated, 435.787.080 reused, 5.202.305 kW produced), and gray label. Small centered footnote: stats estimated from 2025 Q1 projections.
Key takeaway
Icon-left number-right rows scale to many metrics without a grid crush. Projection disclaimer builds trust on enormous figures.
Reuse notes
Use when cumulative impact numbers are the story. Formatting with periods may confuse US audiences; localize separators.