Preview image. Unlock full-res
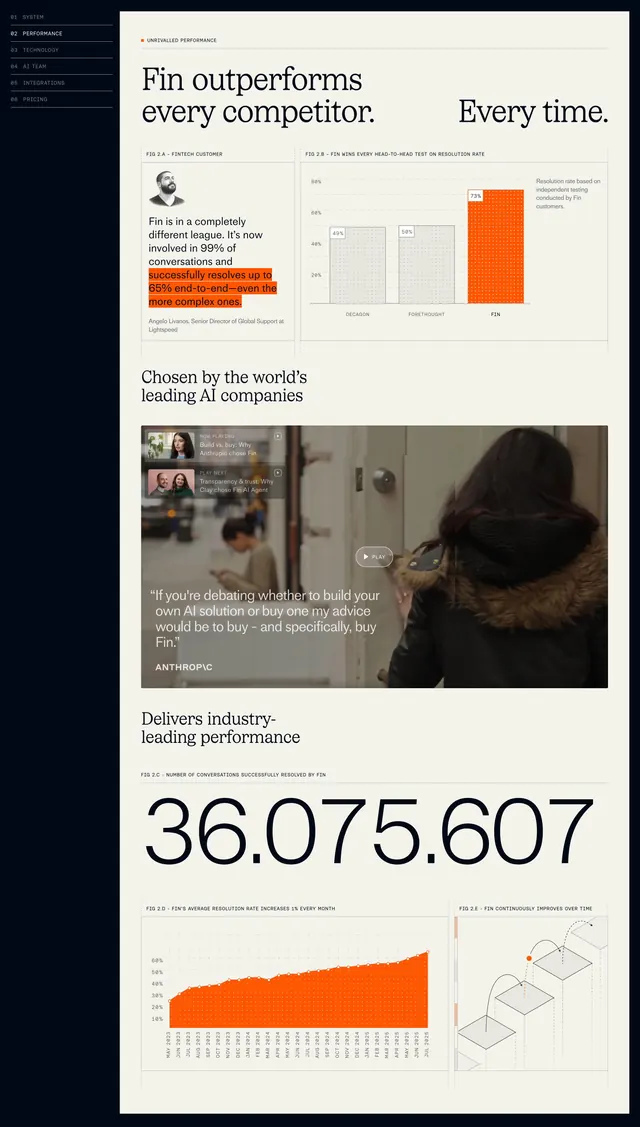
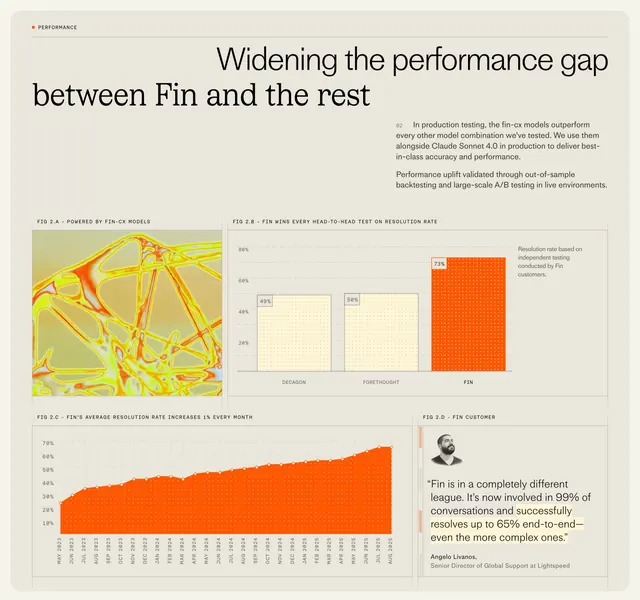
Editorial performance section with dotted four-quadrant grid of charts, abstract imagery, and a customer quote proving fin-cx model superiority.
Summary
A data-forward performance block arguing Fin widens its lead, with headline copy, supporting paragraph, and a four-panel figure grid of charts plus a customer testimonial.
Visual description
Off-white background with thin dotted dividers forming a structured grid. Top left: orange square label and "PERFORMANCE" in caps. Large sans headline reads "Widening the performance gap between Fin and the rest." Right column holds a paragraph on fin-cx models, Claude Sonnet 4.0, and backtesting validation. Below, four labeled figures sit in quadrants. FIG 2.A shows a square abstract fiber or neural web in yellow-orange-red. FIG 2.B is a vertical bar chart comparing Decagon (49%), Forethought (50%), and Fin (73%) resolution rates with dotted bars and orange highlight on Fin. FIG 2.C is an area chart from May 2023 to Aug 2025 climbing from roughly 25% to above 60%. FIG 2.D is a testimonial with a circular avatar, quote on 99% conversation involvement and 65% resolution, and attribution to Angelo Livanos at Lightspeed.
Key takeaway
Figure labels (2.A, 2.B) give a research-paper credibility layer to marketing charts. Orange dotted bar fill differentiates the winner without abandoning a restrained palette.
Reuse notes
Benchmark or competitive proof section for B2B AI products with real test data. Needs defensible metrics and named customers. Dotted grid lines keep dense charts readable on editorial landing pages.