Preview image. Unlock full-res
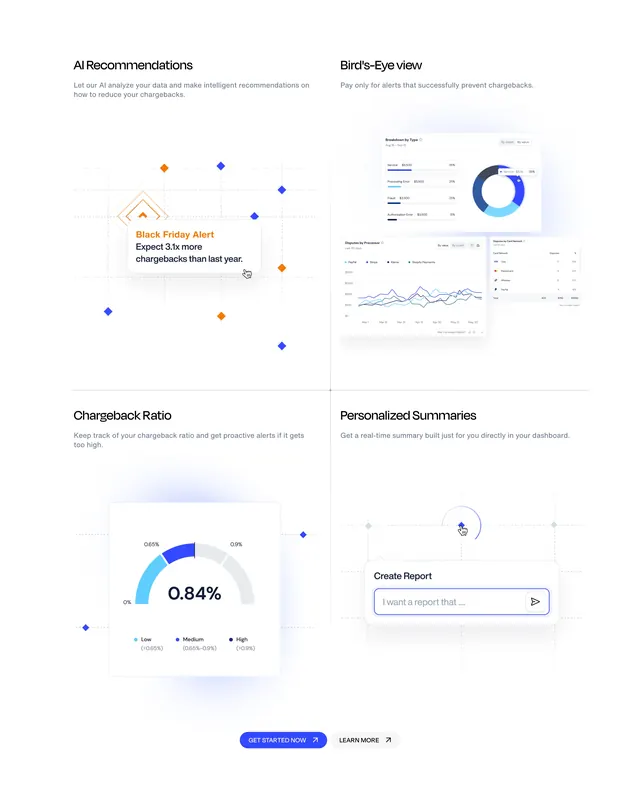
Light four-quadrant bento grid showcasing AI recommendations, dashboard views, chargeback ratio gauge, and personalized report builder with dual CTAs.
Summary
A white four-quadrant product overview with dashboard UI previews for AI alerts, analytics widgets, a chargeback ratio gauge, and an AI report prompt, plus Get started and Learn more buttons.
Visual description
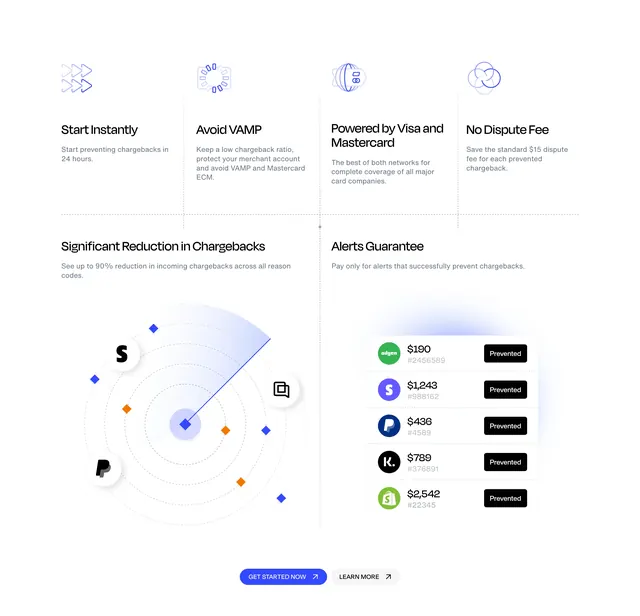
White background with light gray grid lines dividing four equal quadrants. Top-left "AI Recommendations" shows blue-orange diamond node network with a highlighted card reading "Black Friday Alert" and cursor hover. Top-right "Bird's-Eye view" stacks overlapping dashboard cards: donut chart by dispute type, multi-line processor chart, and card-network table. Bottom-left "Chargeback Ratio" shows a semicircular gauge at 0.84% with low/medium/high color bands. Bottom-right "Personalized Summaries" shows a "Create report" input with diamond grid and dashed selection ring. Centered bottom: blue "Get started now" and gray "Learn more" pill buttons with arrows.
Key takeaway
Real UI fragments inside a bento grid sell the product faster than abstract icons. Each quadrant gets one headline, one sentence, and one focused widget crop.
Reuse notes
Ideal for analytics or ops SaaS home sections. Requires polished product screenshots or realistic mock data. Dual CTAs keep exploration path for evaluators.