Preview image. Unlock full-res
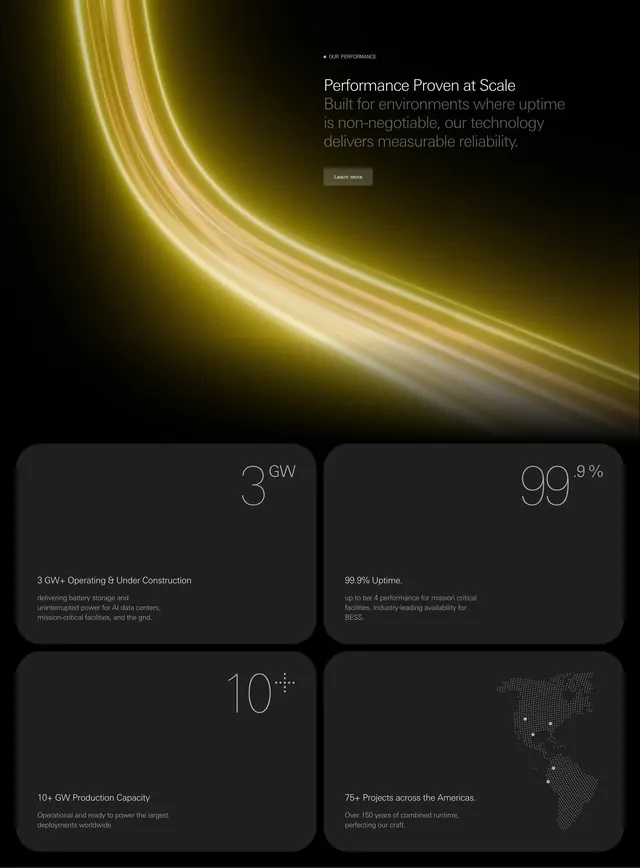
Dark performance hero with golden light-trail graphic and 2x2 stat cards for GW capacity, uptime, production, and Americas map.
Summary
Performance section with golden arc lighting, proven-at-scale copy, and four dark cards quoting GW operating, 99.9% uptime, 10+ GW capacity, and 75+ Americas projects.
Visual description
Black header with sweeping yellow-gold light trail curves, dot label OUR PERFORMANCE, white headline Performance Proven at Scale, gray subcopy on uptime environments, and dark Learn more button. Below, 2x2 grid of dark gray rounded cards with oversized thin white stats: 3 GW plus operating text, 99.9% uptime with superscript styling, 10+ GW with dotted plus graphic, and dotted Americas map with location pins beside 75+ projects and runtime copy.
Key takeaway
Glowing trail graphic gives infrastructure stats an engineered feel without photography. Mixing numeric cards with a map card breaks monotony in a four-stat bento.
Reuse notes
Energy, data center, and industrial scale proof sections. Large thin numerals need room; map card works when geography is a selling point.