Preview image. Unlock full-res
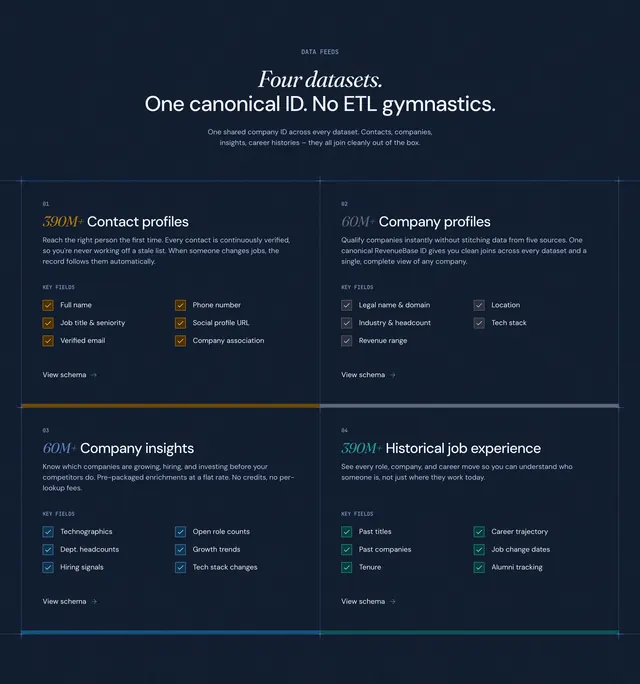
Centered dark DATA FEEDS section with a 2x2 grid of color-accented dataset cards listing scale, copy, key fields, and schema links.
Summary
Centered dark DATA FEEDS section with a 2x2 grid of color-accented dataset cards listing scale, copy, key fields, and schema links.
Visual description
Dark navy canvas with a centered header: small DATA FEEDS eyebrow, a headline mixing italic serif Four datasets. with sans-serif One canonical ID. No ETL gymnastics., and a short muted subparagraph. Below, a 2x2 card grid is outlined by thin light-blue blueprint lines with corner extensions. Each card has a top accent bar in a unique color (orange, light blue, medium blue, teal), an index number, a large italic serif count plus dataset name (390M+ Contact profiles, 60M+ Company profiles, 60M+ Company insights, 390M+ Historical job experience), descriptive body copy, a two-column KEY FIELDS checklist with color-matched square check icons, and a bottom View schema link with arrow. Cards share identical internal structure but differ only in accent hue and field list.
Key takeaway
Color-coded accent bars let four similar datasets stay distinct while preserving one template. Blueprint grid lines signal precision engineering without adding UI chrome. Pairing headline scale numbers with granular key-field checklists bridges marketing promise and technical depth.
Reuse notes
Strong pattern for data products, APIs, or catalog pages where each offering shares schema-like metadata. Keep field lists short and parallel across cards. Accent colors should stay within a tight palette so the grid feels systematic, not decorative.