Preview image. Unlock full-res
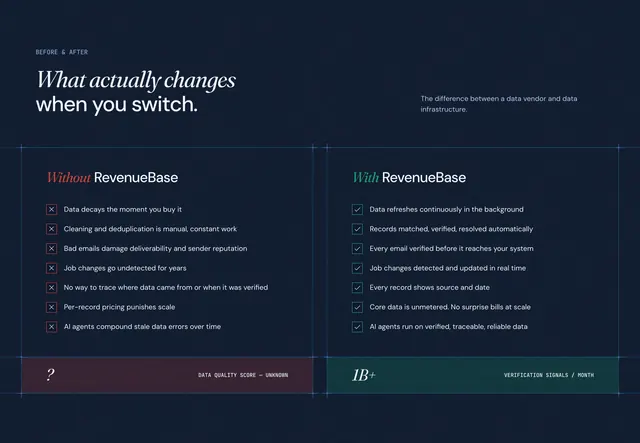
Dark two-column before-and-after comparison contrasting data vendor pain points against RevenueBase infrastructure benefits, with color-coded stat footers.
Summary
Dark two-column before-and-after comparison contrasting data vendor pain points against RevenueBase infrastructure benefits, with color-coded stat footers.
Visual description
Deep navy background with a faint blueprint grid and thin blue corner crosshairs framing the section. A small all-caps eyebrow reads BEFORE & AFTER above a large mixed-type headline: sans-serif white copy with italic serif emphasis on key words. Supporting copy sits top-right in muted gray. Two equal columns sit inside bordered panels: the left column titled Without RevenueBase in coral italic serif with seven red X-marked pain points, ending in a dark red footer bar showing a question mark and DATA QUALITY SCORE: UNKNOWN. The right column titled With RevenueBase in teal italic serif mirrors the list with green checkmarks and ends in a teal footer showing 1B+ and VERIFICATION SIGNALS / MONTH. Body copy is small sans-serif with generous vertical spacing between rows.
Key takeaway
The mirrored before/after list structure makes the value proposition scannable without a traditional feature grid. Color-coded column headers and opposing footer metrics turn abstract claims into a quick visual verdict. Blueprint corner marks and grid lines add technical credibility without clutter.
Reuse notes
Strong for B2B data, infrastructure, or platform switch narratives where prospects need a side-by-side contrast. Works best when each row is a true opposite pair and the footer stat summarizes the emotional takeaway. Needs enough horizontal space for two dense columns; on mobile this likely stacks.
More comparison sections
See all

More like this
Keep what you find
A free account saves references to boards and can send you a weekly email of picks based on what you save.
To see every result, go Pro.