Preview image. Unlock full-res
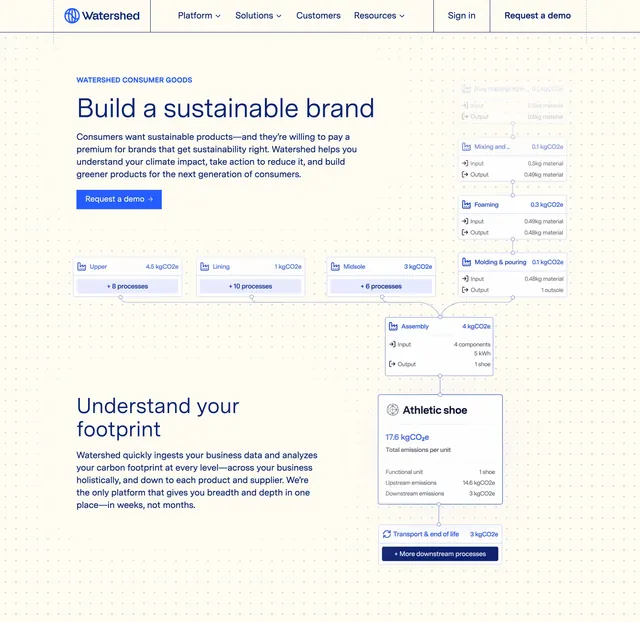
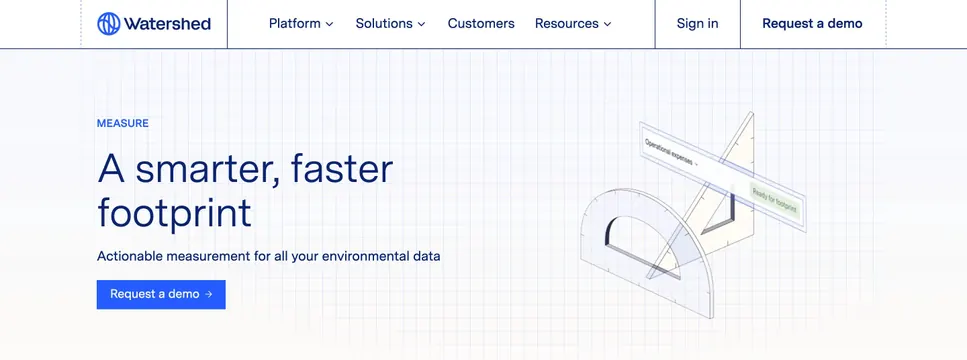
Measure hero on graph paper grid with protractor isometric illustration and Operational expenses dropdown UI.
Summary
A measurement product hero combining graph paper aesthetics, drafting-tool illustration, and finance data UI hints.
Visual description
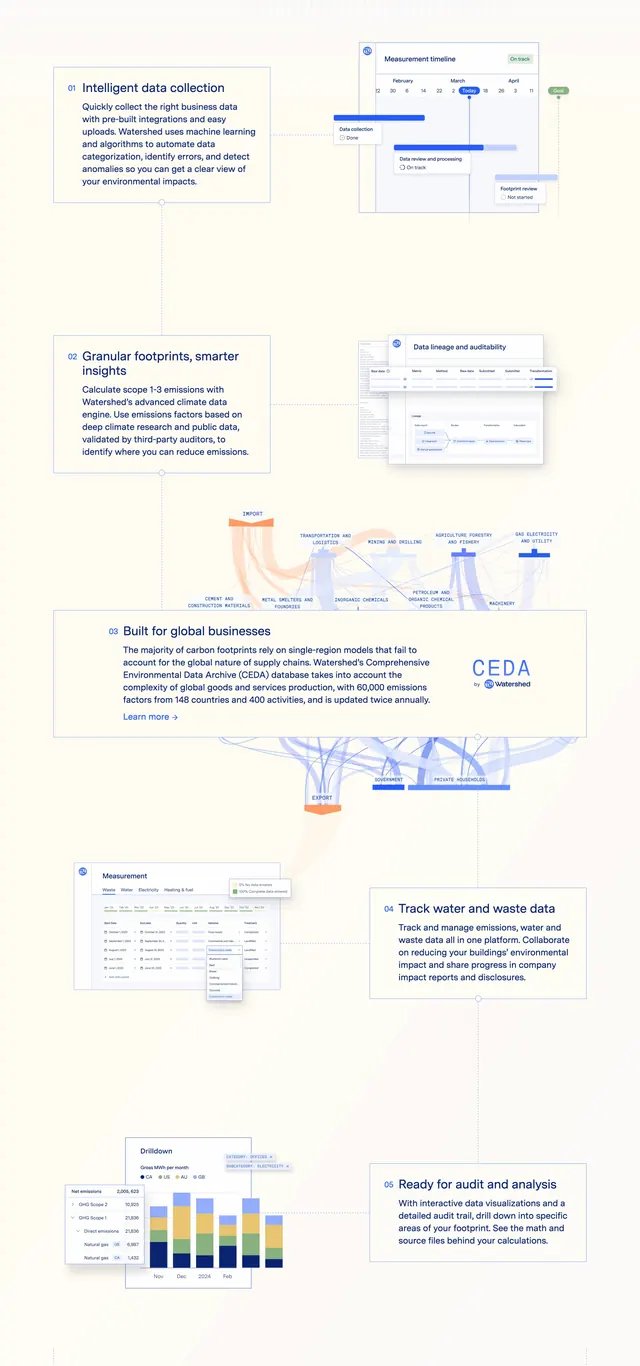
Background with visible graph paper or engineering grid lines. Left: headline about measuring emissions, subcopy, and CTAs. Right: isometric protractor or drafting tool illustration in blues. A UI snippet shows an Operational expenses dropdown or finance category selector integrated into the hero visual, reinforcing accounting-grade data ingestion.
Key takeaway
Graph paper and protractor motifs communicate precision without showing a dense spreadsheet. Embedding a real dropdown documents the actual measurement entry point.
Reuse notes
Strong for measure or data ingestion pages in climate and fintech. Grid background should not compete with headline contrast.