Preview image. Unlock full-res
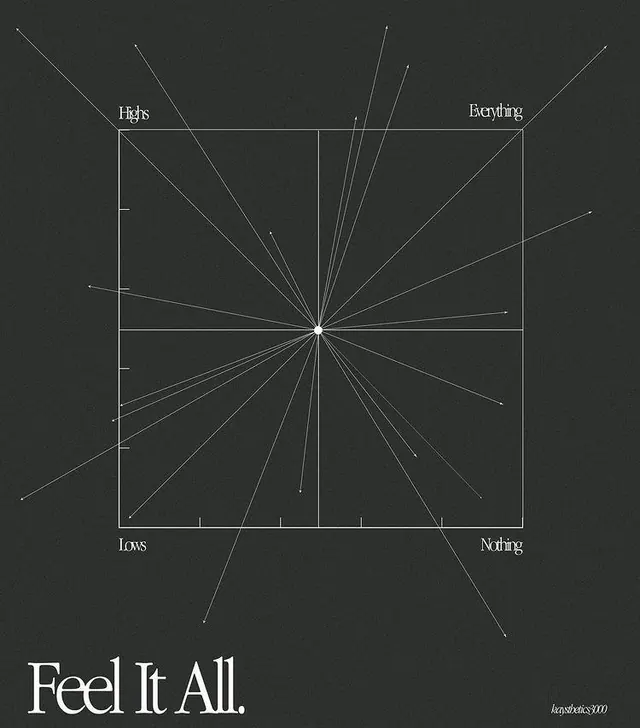
Dark monochromatic diagram mapping emotional extremes (Highs, Lows, Everything, Nothing) via radiating lines from a central point, anchored by the tagline 'Feel It All.
Summary
A monochromatic branding system that visualizes emotional range as a radial diagram, with four labeled axes (Highs, Lows, Everything, Nothing) converging at a central point.
Visual description
Dark charcoal background with a geometric overlay: a centered circle with radiating lines extending outward, creating a precise radial grid. Four cardinal labels in serif type mark the extremes of an emotional spectrum. Fine white lines form a rectangular frame and guide-marks along the diagram's edges. The wordmark "Feel It All." sits in white serif type in the lower left, with a small designer mark (Hedstiks.S100) in the lower right corner. The overall aesthetic is technical and grid-based, evoking dimensional analysis or data visualization.
Key takeaway
The use of radiating geometry to show a spectrum or range (often applied to emotional states, brand territories, or capability matrices). The layering of fine lines with labeled axes creates visual hierarchy and meaning without illustration or color.
Reuse notes
Strong for conceptual branding systems, mood maps, or frameworks that position ideas or feelings across opposing poles. Works well when the spectrum itself (not the label) is the primary message. The monochromatic treatment keeps it versatile across print and digital.
More like this






Keep what you find
A free account saves references to boards and can send you a weekly email of picks based on what you save.
To see every result, go Pro.