Preview image. Unlock full-res
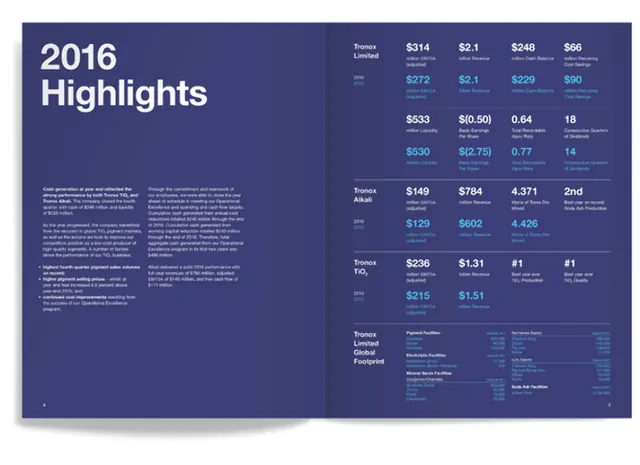
Dark indigo-purple annual report spread with structured financial tables, white and teal typography, and minimal left-side narrative text.
Summary
Dark indigo-purple annual report spread with structured financial tables, white and teal typography, and minimal left-side narrative text for 2016 company highlights.
Visual description
Left side holds a narrow column of body text in white sans-serif on the dark background. Right side is dominated by a grid of data tables organized in rows and columns, each cell containing dollar amounts or percentages. Teal accent color highlights key figures (row headers like "Target A", "Target B") and some numerical values. The tables use consistent sizing and alignment, with subtle grey dividing lines creating clear visual separation. The palette of deep purple, white, teal, and grey creates strong contrast without being harsh, anchoring the data hierarchy.
Key takeaway
The restrained two-color accent system (white plus single teal highlight) making data tables legible without overwhelm. The vertical split between narrative context (left) and comparative metrics (right) guides viewers through interpretation before detailed number reading. The grid structure stays compact and scannable.
Reuse notes
Ideal for fintech dashboards, b2b analytics reports, or any institutional communication requiring credibility and clear KPI presentation. The indigo-purple background choice reads premium while remaining serious. Works for printed annual reports, investor decks, or digital financial product onboarding flows.
More like this
Keep what you find
A free account saves references to boards and can send you a weekly email of picks based on what you save.
To see every result, go Pro.