Preview image. Unlock full-res
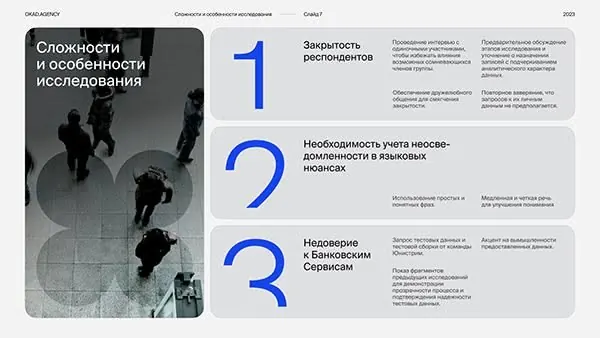
Three-step research presentation with dark silhouettes, oversized blue numerals, and gray text blocks on white, emphasizing academic findings on trust and banking.
Summary
A three-point research summary layout pairing silhouette photography on the left with white content blocks and oversized blue numerals (1, 2, 3) on the right, presenting key findings on research complexity, respondent trust, and banking service understanding in Russian.
Visual description
Left half features silhouettes of three people in conversation against a teal background. Right side breaks into three stacked white cards, each opening with a bold, oversized blue numeral (1, 2, 3) anchoring the layout. Body copy in gray type below each number explains the finding; a secondary paragraph with smaller text on the far right provides supporting context. The color palette is strictly teal, white, black, and blue, creating clean contrast. Type is uniformly sans-serif with clear hierarchy between the numeral, headline, and body.
Key takeaway
The pairing of human silhouettes with data blocks adds emotional weight without faces. Large numerals create a visual rhythm that forces sequential reading. The split-left-imagery/right-type layout is highly efficient for presenting multiple findings on a single card.
Reuse notes
Ideal for research reports, fintech thought leadership, or B2B presentations. The silhouettes work well when anonymity or group dynamics are important to the story. Works best at large scales where the blue numeral is immediately visible.
More like this
Keep what you find
A free account saves references to boards and can send you a weekly email of picks based on what you save.
To see every result, go Pro.