Preview image. Unlock full-res
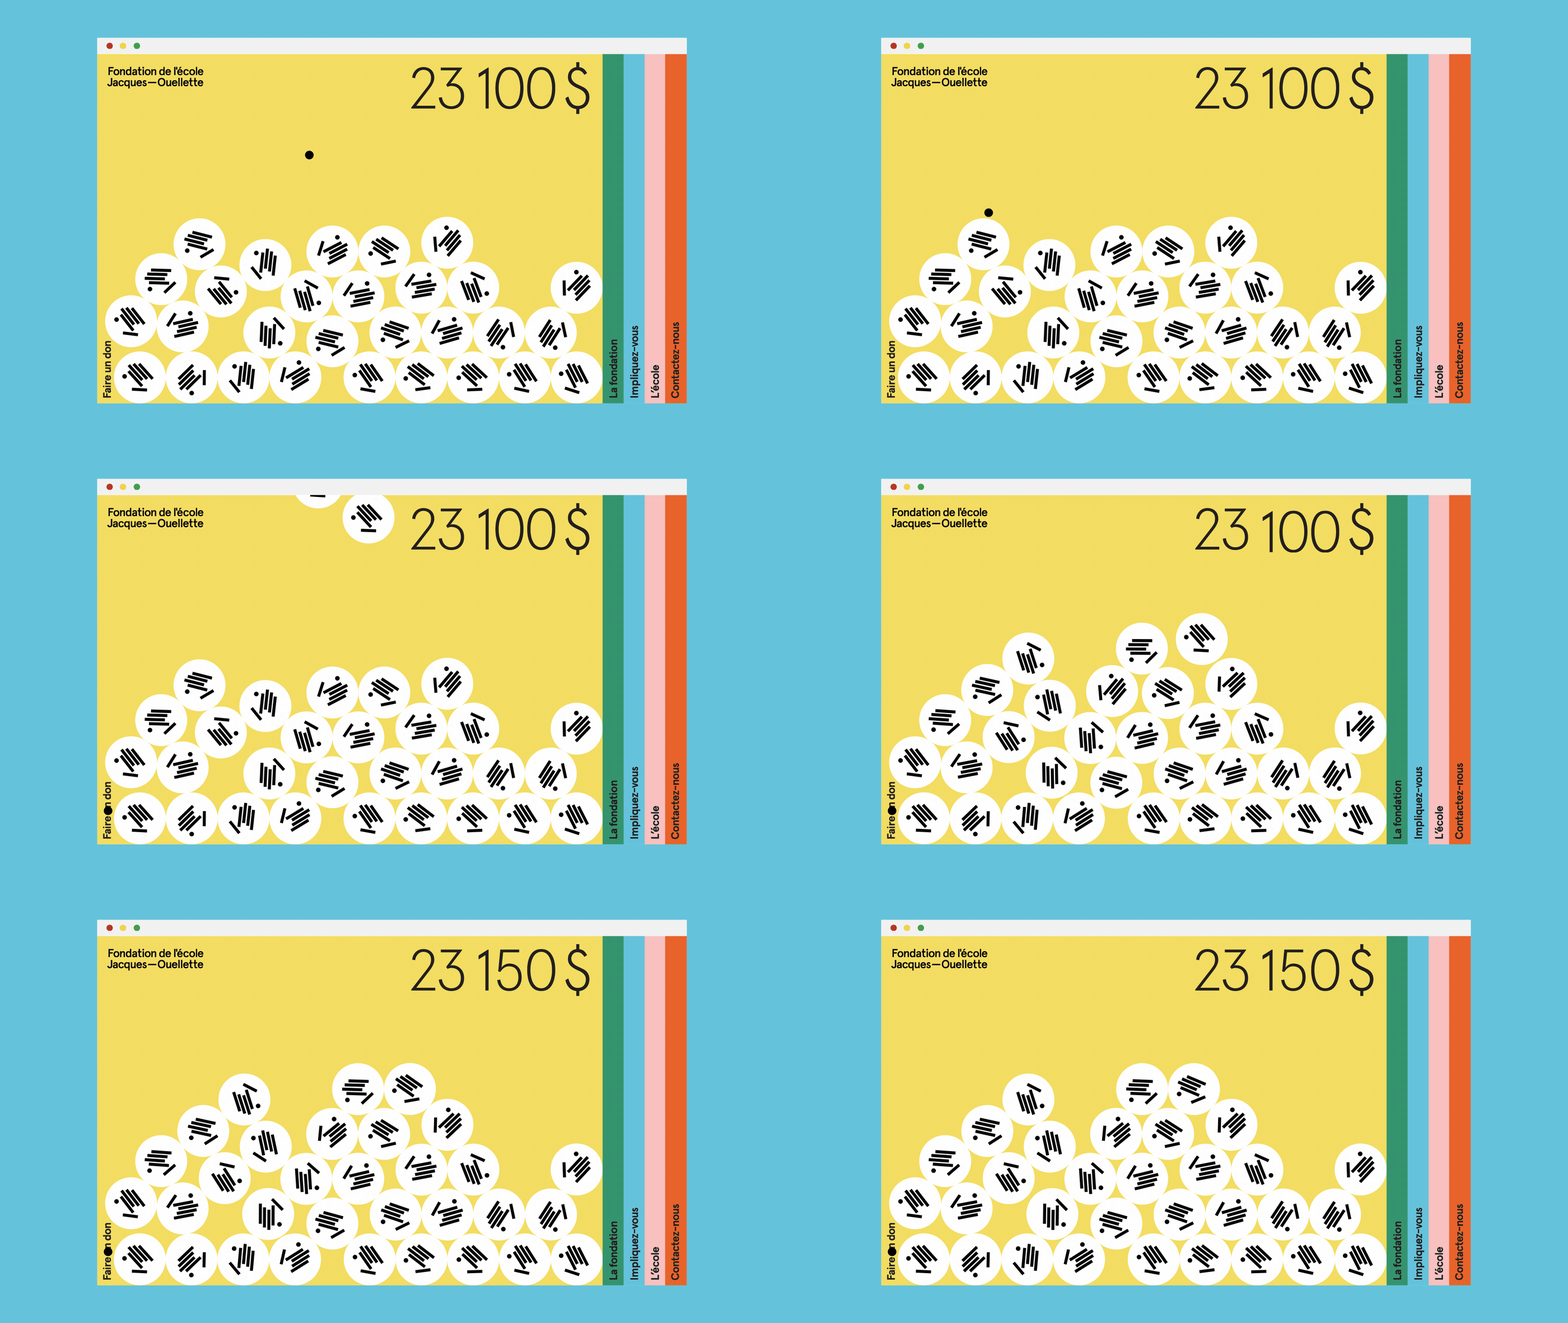
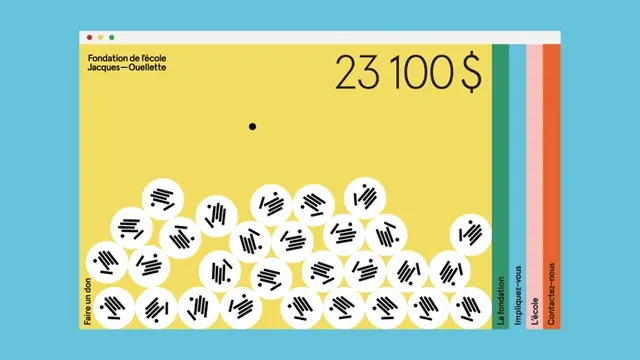
Bright yellow fundraising infographic with a grid of white circular donor icons and a large donation total, anchored by a colorful vertical legend strip.
Summary
A cheerful fundraising infographic using a grid of circular striped icons to represent individual donors, with a prominent donation total and a color-coded category legend.
Visual description
Bright yellow background dominates the composition. A browser window frame sits at the top with a headline in French (Fondation de l'école Jacques-Ouellette) and a large numeric total (23,100 $) positioned in the upper right. Below, approximately 30 white circles arranged in a flowing grid pattern, each containing black striped icons suggesting contributions or donor categories. A single black dot sits centered above the grid, acting as a focal point. On the right edge, four thin vertical bars in teal, light blue, peach, and orange provide a colorful categorical legend. The overall composition balances data density with white space, keeping the information hierarchy clear.
Key takeaway
The visual pattern of white circles with icon fills creates a modular, scalable donor-visualization system. The categorical color bars on the edge work as a compact legend without cluttering the main visual. The overall yellow field and simple sans-serif type convey approachability and optimism while handling numeric data professionally.
Reuse notes
Strong template for nonprofit campaigns, school fundraising, and community initiatives where you need to visualize aggregate contributions or donor counts. Works best when donors or categories map cleanly to icon variations. The grid structure is flexible for different data volumes.
More like this






Keep what you find
A free account saves references to boards and can send you a weekly email of picks based on what you save.
To see every result, go Pro.