Preview image. Unlock full-res
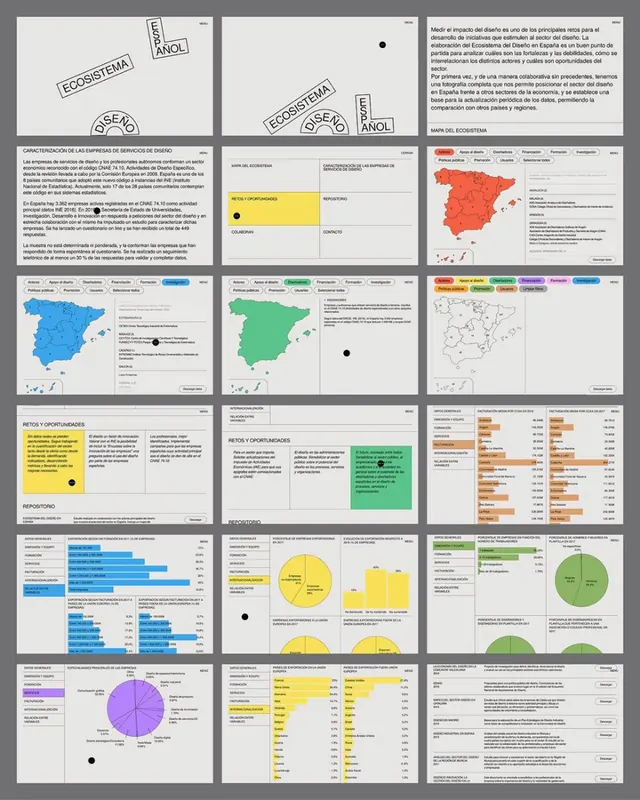
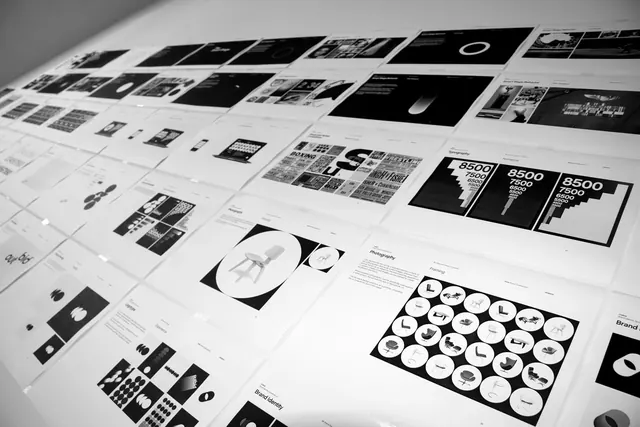
A 15-page modular layout grid for an environmental report, using colored data visualizations, maps, charts, and text blocks arranged in structured 3x5 arrangement.
Summary
A 15-page report layout template showing modular grid systems with colored maps, bar charts, pie charts, and text blocks arranged in repeating patterns.
Visual description
A contact sheet of 15 pages arranged in a 3x5 grid, each page containing a modular layout template. Pages combine monochrome backgrounds (light grey, white) with colored accent blocks in yellow, red, green, and blue. Each spread features combinations of: thematic maps of geographic regions, bar charts showing data trends, pie charts, body text in columns, headings, and labeled data points. Sans-serif typography remains consistent across pages. Variation comes from different chart types, map regions, and placement of text blocks within a clear grid structure. The system demonstrates repeatability while allowing content flexibility.
Key takeaway
Modular grid structure allows consistent layout across many pages while accommodating varied data types. Monochrome background with strategic colored accents (maps, charts) focuses attention without visual noise. Repeated column and section patterns make the report feel systematic and authoritative. The constraint of the grid paradoxically enables variety through content permutation.
Reuse notes
Essential reference for environmental reports, sustainability reporting, data-heavy B2B communications, academic research layouts, and annual reports. Works especially well when presenting geographic or trend data that benefits from map and chart visualization. The neutral base with colored accents suits serious, analytical communication where data integrity and clarity dominate over visual drama.
More like this

Keep what you find
A free account saves references to boards and can send you a weekly email of picks based on what you save.
To see every result, go Pro.