Preview image. Unlock full-res
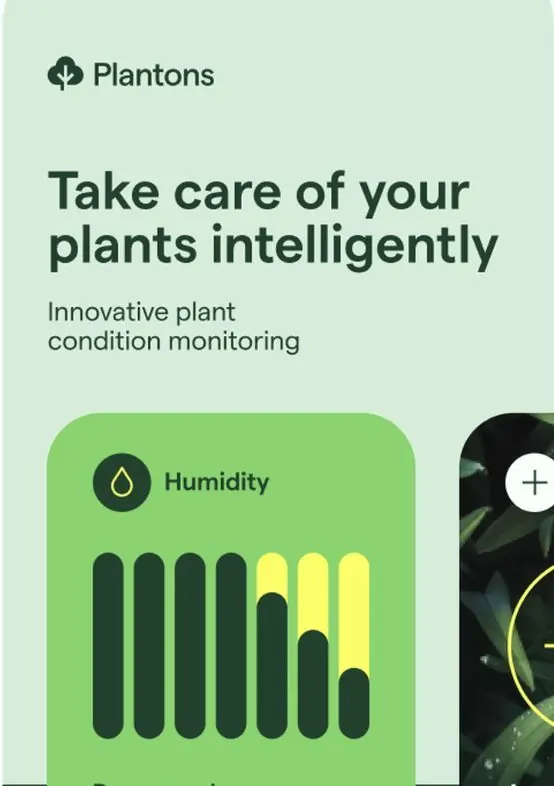
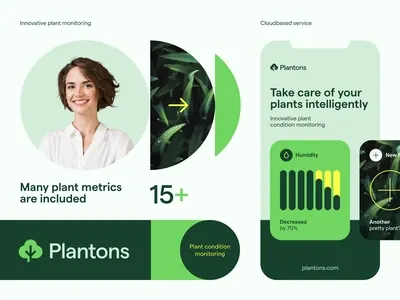
A mobile app interface for plant care monitoring featuring a soft sage-green palette and bar-chart data visualization for humidity tracking.
Summary
A mobile app screen for the Plantons plant-care platform displaying humidity monitoring data with rounded bar charts and simplified controls.
Visual description
The screen begins with the Plantons logo and headline "Take care of your plants intelligently" followed by subtitle "Innovative plant condition monitoring." Below is a prominent card with a humidity sensor icon (water droplet) and a bar chart showing seven rounded-rectangle bars in graduating shades from dark teal to pale yellow, indicating humidity levels. A light sage-green background unifies the design. Typography is bold and sans-serif for the headline, lighter weight for body copy. A secondary card is partially visible on the right edge with a circular plus icon on dark background, suggesting additional metrics are available. The design emphasizes clarity and calm through ample white space and organic, curved forms.
Key takeaway
The progression of bar heights with color shifting from saturation to highlight creates both visual interest and instant data readability. Rounding all elements (cards, bars, icons) softens the tech feel and pairs perfectly with nature-focused apps. The two-tone card approach (light background card on colored background) creates hierarchy without borders.
Reuse notes
Ideal for health monitoring, IoT, or nature-tech apps targeting consumers. The soft green palette and organic language resonate with sustainability, wellness, and gardening audiences. Works well for MVP or onboarding screens where you need to explain a single metric clearly. The card-based layout is easily expandable to multi-metric dashboards.
More like this

Keep what you find
A free account saves references to boards and can send you a weekly email of picks based on what you save.
To see every result, go Pro.