Preview image. Unlock full-res
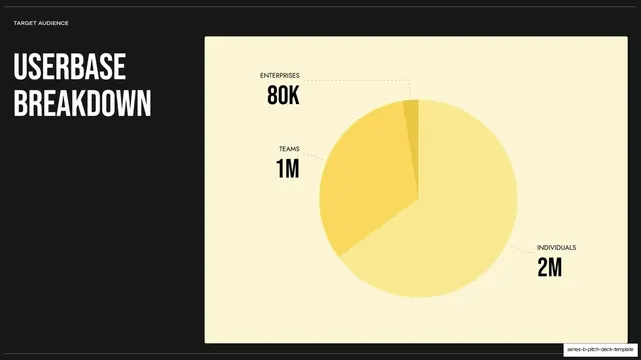
Target-audience slide splitting a left headline against a large cream panel holding a yellow pie chart of userbase segments.
Summary
A target-audience slide: a short left headline ("USERBASE BREAKDOWN") set against a large cream panel with a yellow pie chart segmenting the userbase.
Visual description
A near-black slide with a "TARGET AUDIENCE" utility label on a hairline rule at top left. The left third holds a two-line oversized condensed all-caps headline in white, "USERBASE BREAKDOWN". The right two-thirds is a large cream rounded panel containing a pie chart rendered in tones of yellow (pale and saturated wedges with no other colors). Three dashed leader lines point from the wedges to dark callouts, each a small all-caps label over a bold number: ENTERPRISES 80K, TEAMS 1M, and INDIVIDUALS 2M.
Key takeaway
Keeping the chart monochrome within the accent color so it reads as part of the brand rather than a generic spreadsheet graphic. Floating the chart on a bright cream panel against the dark ground, and labeling wedges with dashed callouts (small label plus big number) instead of a separate legend.
Reuse notes
A clean segmentation or market-breakdown layout for a target-audience, market-size, or data slide. The segments and figures are placeholders. The single-hue chart trick only works when your accent has enough tonal range to separate wedges; add a second tone if segments blur together.
From this deck: Userbase breakdown pie chart
View deck


More like this





Keep what you find
A free account saves references to boards and can send you a weekly email of picks based on what you save.
To see every result, go Pro.